Indices
Wednesday, April 02, 2014
INDICES:ITS REAL BULLS OR BUBBLES:

Sensex & nifty both ended quarterly positive close at highest levels at then end of quarter ended 31.03.2014.
sensex closed 22,386.27 levels & Nifty closed @ 6704.20 levels on 31.03.2014.
Still there is question in many peoples mind that ITS REAL BULLS OR BUBBLES?
Is this Euphoric liquidly driven Bear market rally?
I think that answer is debatable & vary from Analyst to Analyst but we have to understand few facts & observations that gives an idea about which sides is favorable. In other words more probabilities of evidences/observations are in which side? (i.e.: Positive or Negative side).
This answer normally gives us an idea of medium to long term of market trend from technical Analysis perspectives.
Few of the observations turning to positive side for medium to long term trend of the market are as follows.
1. Market has given price wise confirmation after breaking this range on upside of 6350 levels on nifty & 21200 levels after 6 years. Its also sustaining above these levels while writing this article therefore, its to be confirmed as valid break out till its proven otherwise.
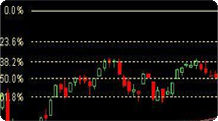
2. Quarterly KST of sensex came in to BUY on recent quarter ended 31.03.2014. Its came in to BUY after 6 years of Time wise Bear market as per chart attached. It last went in to sell on 30.06.2008 @ 13461.60 levels. Its very strong indicator thats pointing medium to long term bull market for Indian equity. Its indicating beginning of 3-5 years Bull market.
This Quarterly KST (Momentum Indicators) is very powerful. It rarely fails. It has failed only in 1999-2000 instances after confirming breakout & made all time highs as per chart attached & eventually it resulted in to sharp disaster & collapse in Indian equity market. The whole rally turned out to be euphoric rally. Therefore, whether its the same as 1999-2000 case?
I think currently we have to go with available positive facts as written till its proven otherwise unless we get any other advance evidences indicating faltering of recent rally.
3. I have written & discussed many times in this indices column about Bullish Structure from Elliot wave count perspectives. I also mentioned that Indian Equity Market is going to be next out performing asset class. Its just beginning & we have to achieve many higher levels targets in this journey on the way ahead.
4. The recent rise from bottom of 19963.12 levels on sensex & 5933 levels on nifty on 04.02.2014 can be counted as Impulsive wave. Many stocks & Indices as well recent rise from these bottom time frames can be counted as impulsive waves . Its a sign of Bullish structure till its proven wise. Its indicates any kind of consolidation or profit booking is buying opportunity for medium to long term perspectives further higher levels targets.
One more thought I want to share from fundamental perspectives.
In fundamental Research we studied TOP-DOWN APPROACH. (I.e. Economy/Industry/Company Analysis)
It has assumption that if economy is doing well then Industry & eventually company can do better. This kind of approach that we have seen at middle of Bull market.
But In other approach we studied BOTTOM-TOP APPROACH.
(I.e. - Company/Industry/Economy Analysis).
It has assumption that Company Starts to perform first & eventually Whole Industry & Economy can do better.
Normally, this scenario is beginning of bull market or end of Bear phase. At the beginning phase, economy & Industry are not doing well but there is company specific value buying emerges in spite of too much pessimism & eventually it turns out to be bottom of bear market phase. Global factors are exceptional to this theory.
2008-2009 is a good example to justify this theory. In which case, at bottom there is too much pessimism & economy was still in bad phase but market made a bottom & stock specific value buying emerged at lower levels & eventually it resulted in to 100 % run from bottom.
So at current scenario also, some people still argues about poor economic & industry situation for Indian financial market. But by looking above examples of 2008-2009 bottom phases, one thing is very clear that beginning of any strong power full bull market emerges with bottom top approach.
In other words, Market is already confirming breakout in advance & trading at all time high levels ahead of an Economic & Industry Revival.
Conclusively, I shared my observations & thoughts both from technical & Fundamentals perspectives for this rally ITS REAL BULLS OR BUBBLES & It looks like REAL BULLLS to me till its proven otherwise or we get any further evidences of faltering this rally in advance.
Still there is question in many peoples mind that ITS REAL BULLS OR BUBBLES?
Is this Euphoric liquidly driven Bear market rally?
I think that answer is debatable & vary from Analyst to Analyst but we have to understand few facts & observations that gives an idea about which sides is favorable. In other words more probabilities of evidences/observations are in which side? (i.e.: Positive or Negative side).
This answer normally gives us an idea of medium to long term of market trend from technical Analysis perspectives.
Few of the observations turning to positive side for medium to long term trend of the market are as follows.
1. Market has given price wise confirmation after breaking this range on upside of 6350 levels on nifty & 21200 levels after 6 years. Its also sustaining above these levels while writing this article therefore, its to be confirmed as valid break out till its proven otherwise.
2. Quarterly KST of sensex came in to BUY on recent quarter ended 31.03.2014. Its came in to BUY after 6 years of Time wise Bear market as per chart attached. It last went in to sell on 30.06.2008 @ 13461.60 levels. Its very strong indicator thats pointing medium to long term bull market for Indian equity. Its indicating beginning of 3-5 years Bull market.
This Quarterly KST (Momentum Indicators) is very powerful. It rarely fails. It has failed only in 1999-2000 instances after confirming breakout & made all time highs as per chart attached & eventually it resulted in to sharp disaster & collapse in Indian equity market. The whole rally turned out to be euphoric rally. Therefore, whether its the same as 1999-2000 case?
I think currently we have to go with available positive facts as written till its proven otherwise unless we get any other advance evidences indicating faltering of recent rally.
3. I have written & discussed many times in this indices column about Bullish Structure from Elliot wave count perspectives. I also mentioned that Indian Equity Market is going to be next out performing asset class. Its just beginning & we have to achieve many higher levels targets in this journey on the way ahead.
4. The recent rise from bottom of 19963.12 levels on sensex & 5933 levels on nifty on 04.02.2014 can be counted as Impulsive wave. Many stocks & Indices as well recent rise from these bottom time frames can be counted as impulsive waves . Its a sign of Bullish structure till its proven wise. Its indicates any kind of consolidation or profit booking is buying opportunity for medium to long term perspectives further higher levels targets.
One more thought I want to share from fundamental perspectives.
In fundamental Research we studied TOP-DOWN APPROACH. (I.e. Economy/Industry/Company Analysis)
It has assumption that if economy is doing well then Industry & eventually company can do better. This kind of approach that we have seen at middle of Bull market.
But In other approach we studied BOTTOM-TOP APPROACH.
(I.e. - Company/Industry/Economy Analysis).
It has assumption that Company Starts to perform first & eventually Whole Industry & Economy can do better.
Normally, this scenario is beginning of bull market or end of Bear phase. At the beginning phase, economy & Industry are not doing well but there is company specific value buying emerges in spite of too much pessimism & eventually it turns out to be bottom of bear market phase. Global factors are exceptional to this theory.
2008-2009 is a good example to justify this theory. In which case, at bottom there is too much pessimism & economy was still in bad phase but market made a bottom & stock specific value buying emerged at lower levels & eventually it resulted in to 100 % run from bottom.
So at current scenario also, some people still argues about poor economic & industry situation for Indian financial market. But by looking above examples of 2008-2009 bottom phases, one thing is very clear that beginning of any strong power full bull market emerges with bottom top approach.
In other words, Market is already confirming breakout in advance & trading at all time high levels ahead of an Economic & Industry Revival.
Conclusively, I shared my observations & thoughts both from technical & Fundamentals perspectives for this rally ITS REAL BULLS OR BUBBLES & It looks like REAL BULLLS to me till its proven otherwise or we get any further evidences of faltering this rally in advance.