
Market Outlook
FRIDAY, JULY 06, 2018
Market Outlook (Closing) as on 06.07.2018
Market closed in positive territory at 35,657.86 (+ 83.31)
AT UPPER END OF RANGE NEAR BREAKOUT ONCE AGAIN:
STILL TRADING IN RANGE: TRAIL TILL IT REVERSES:
STRONG DIVERGENCE BETWEEN NIFTY/SENSEX MAIN INDICES & BROADER MARKET INDICES:
ANY KIND OF SHORT TERM VOLTALITY/ CONSOLIDATION OR DECLINE IS STOCK SPECIFIC BUYING OPPORTUNITY FOR SHORT TO MEDIUM TERM INVESTMENT PERSPECTIVES:TRAIL TILL IT REVERSES:
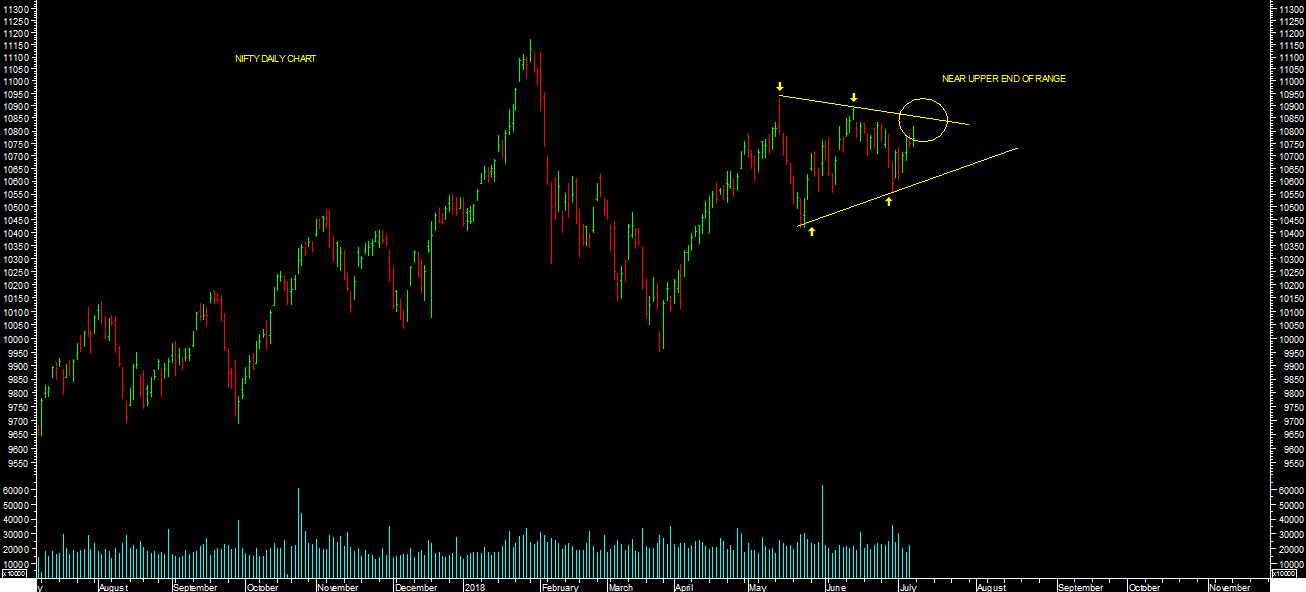
 Makret closed at upper end of range near breakout levels at the end of weekly trading session. It closed weekly in positive territory. It made a high of 10816.40 levels & 35,799.71 levels during week. Its still consolidating in the broad range of 10400-10900 levels from past one & half month. Break of these rnage will only lead to strong trend in the makret for higher levels targets as mentioned below in short to medium term.
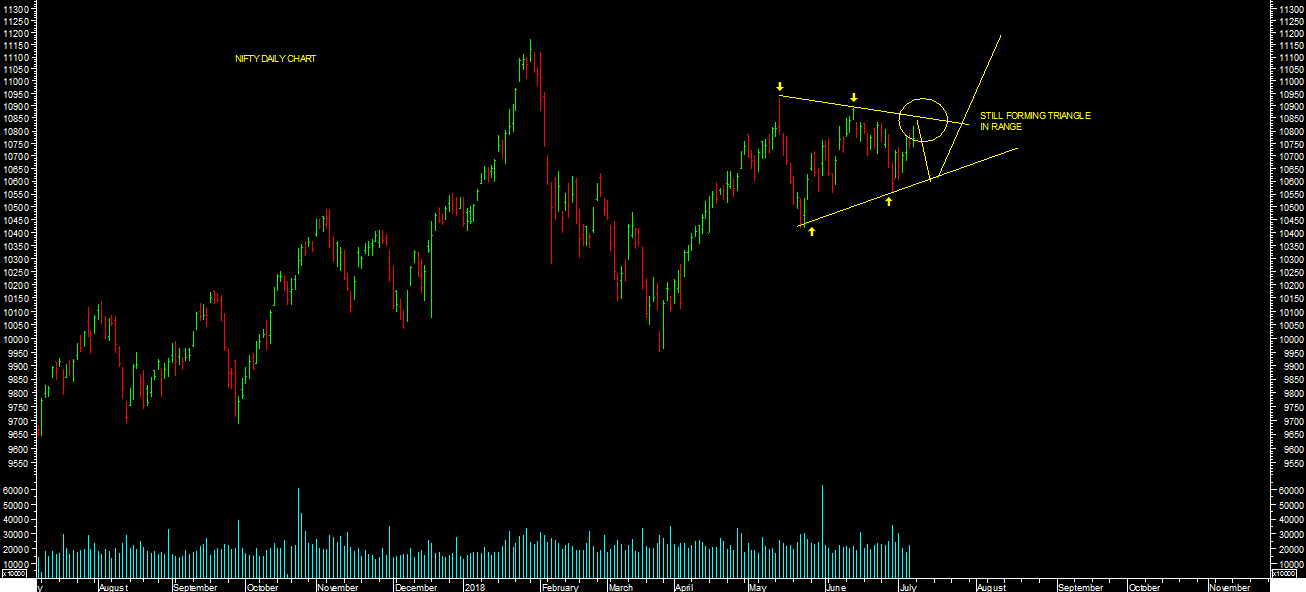
It looks like wave-II of 5 consolidation as per chart attached. If we have completed FLAT correction then, we can see high probability to break this range on upside in coming weeks. Failed to break this range on upside in coming trading session will open up possibility of trigular fomration & we may further re-test lower end of range before final wave-III of 5 begins.
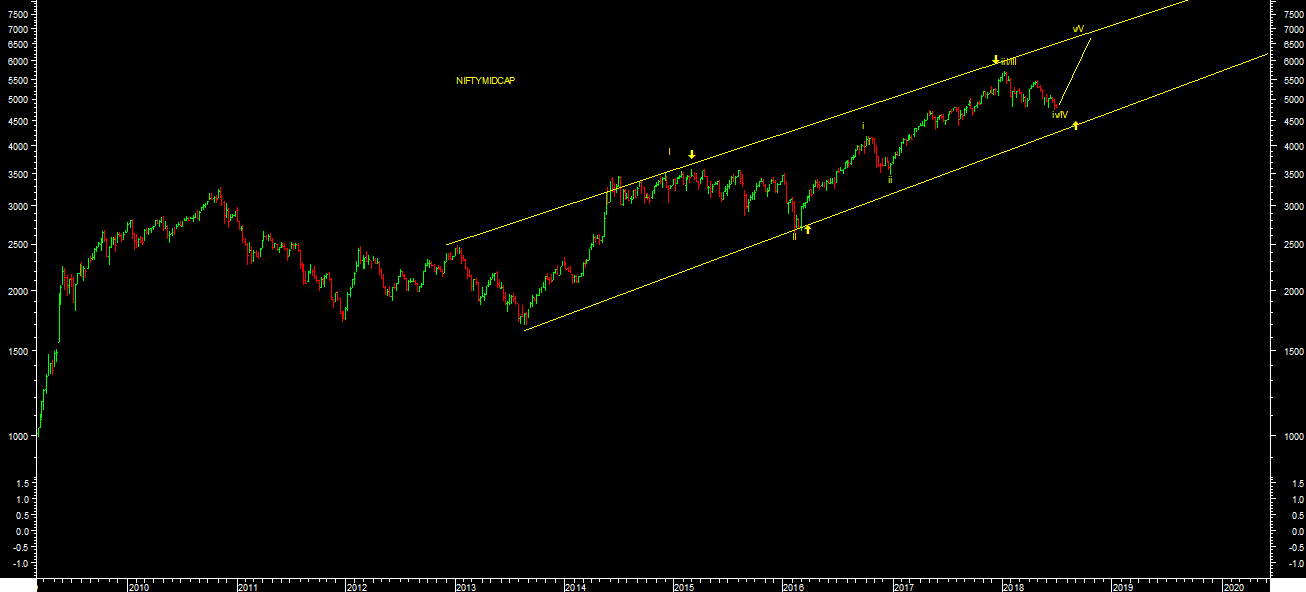
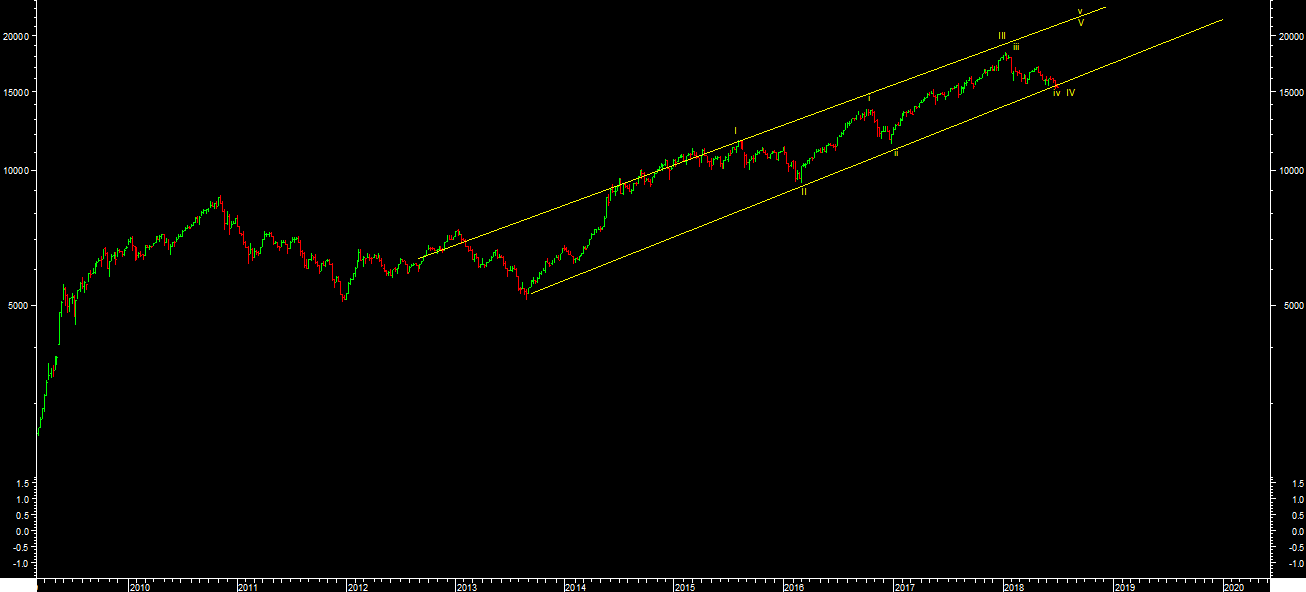
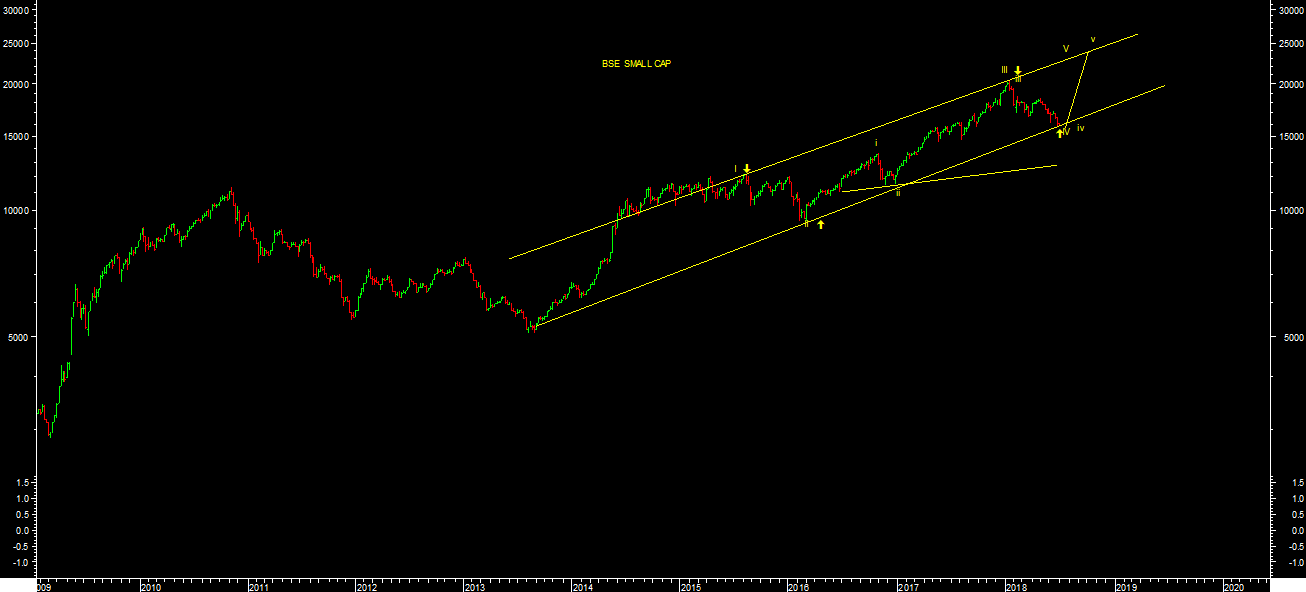
It still looks like wave-II of (5) consoldation phase on main indices nifty/sensex as per chart attached. There is strong divergence between Nifty/Sensex main indices & Broader Market in short term from last couple of months. And we have seen sharp sell off particularly in broader market in near term. I feel this divergence is going to end soon, once we break out of this short term range on main indices. And we will see strong rebound in broader market. This correction is opportunity to BUY quality beaten down stocks of midcap & small cap index from medium to long term perspectives. All these broader market indices such as midcap & small cap are trading at very cruial support zone as per chart attached.
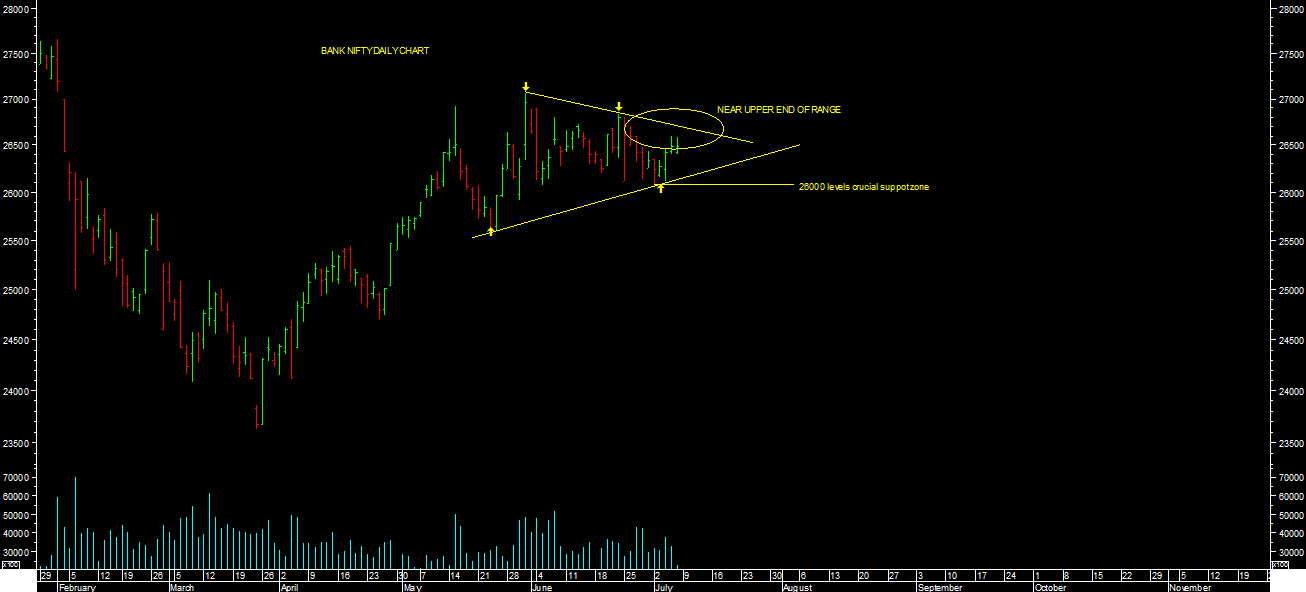
BANK NIFTY closed weekly in positive territory. Its consolidating in narrow range between 27000-25550 levels in near term. 25550 levels is strong support for bank nifty for short term, till it holds one can exepct higher levels targets till 27700 levels in short term & further above 29600-30000 levels in medium term. Any kind of decline is also buying opportunity for bank nifty for short to medium term perspectives.
10600 & 11000 levels is strong support & resistance levels based on option open interest data for currnet month series expiry perspectives. By looking at current structure, I feel market is going to surpass all time high soon on main indices & this rally will have time wise consolidation rather than price wise correction in short term. Any kind of such short term correction or consolidation is buying opportunity for medium to long term Investment perspectives till medium term reverses.
Momentum indicators Daily KST & DAILY MACD both are in BUY supporting short term trend. One should be stock specific & follow the trend with trail stop loss levels till it reverses. Close below short term reversal levels will lead to sharp correction till 10300-10200 levels on nifty & 33600 levels on sensex in short term.
Momentum Perspective:
Weekly KST & WEEKLY MACD both are in BUY & Its trading above both 20WESM & 40 WEMA . All Medium term Parameters are showing strength.One can expect market to trend towards higher level targets in medium term. Any kind of short term correction or consolidation in buying opportunity for medium to long term Investment perspectives till it reverses.
Conclusion:
Short Term Trend is UP & Medium term Trend is UP.
Trend
Market Outlook (Closing) as on 06.07.2018
Market closed in positive territory at 35,657.86 (+ 83.31)AT UPPER END OF RANGE NEAR BREAKOUT ONCE AGAIN:
STILL TRADING IN RANGE: TRAIL TILL IT REVERSES:
STRONG DIVERGENCE BETWEEN NIFTY/SENSEX MAIN INDICES & BROADER MARKET INDICES:
ANY KIND OF SHORT TERM VOLTALITY/ CONSOLIDATION OR DECLINE IS STOCK SPECIFIC BUYING OPPORTUNITY FOR SHORT TO MEDIUM TERM INVESTMENT PERSPECTIVES:TRAIL TILL IT REVERSES:
It looks like wave-II of 5 consolidation as per chart attached. If we have completed FLAT correction then, we can see high probability to break this range on upside in coming weeks. Failed to break this range on upside in coming trading session will open up possibility of trigular fomration & we may further re-test lower end of range before final wave-III of 5 begins.
It still looks like wave-II of (5) consoldation phase on main indices nifty/sensex as per chart attached. There is strong divergence between Nifty/Sensex main indices & Broader Market in short term from last couple of months. And we have seen sharp sell off particularly in broader market in near term. I feel this divergence is going to end soon, once we break out of this short term range on main indices. And we will see strong rebound in broader market. This correction is opportunity to BUY quality beaten down stocks of midcap & small cap index from medium to long term perspectives. All these broader market indices such as midcap & small cap are trading at very cruial support zone as per chart attached.
BANK NIFTY closed weekly in positive territory. Its consolidating in narrow range between 27000-25550 levels in near term. 25550 levels is strong support for bank nifty for short term, till it holds one can exepct higher levels targets till 27700 levels in short term & further above 29600-30000 levels in medium term. Any kind of decline is also buying opportunity for bank nifty for short to medium term perspectives.
10600 & 11000 levels is strong support & resistance levels based on option open interest data for currnet month series expiry perspectives. By looking at current structure, I feel market is going to surpass all time high soon on main indices & this rally will have time wise consolidation rather than price wise correction in short term. Any kind of such short term correction or consolidation is buying opportunity for medium to long term Investment perspectives till medium term reverses.
Momentum indicators Daily KST & DAILY MACD both are in BUY supporting short term trend. One should be stock specific & follow the trend with trail stop loss levels till it reverses. Close below short term reversal levels will lead to sharp correction till 10300-10200 levels on nifty & 33600 levels on sensex in short term.
Momentum Perspective:
Weekly KST & WEEKLY MACD both are in BUY & Its trading above both 20WESM & 40 WEMA . All Medium term Parameters are showing strength.One can expect market to trend towards higher level targets in medium term. Any kind of short term correction or consolidation in buying opportunity for medium to long term Investment perspectives till it reverses.Conclusion:
Short Term Trend is UP & Medium term Trend is UP.
Trend
| Short Term : | Trend | Reversal |
| 36300-36500 | 34302 | |
| Medium Term : | Trend | Reversal |
| 38200-38500 | 29077 |
| Short Term : | Trend | Reversal |
| 11000-11200 | 10417 | |
| Medium Term : | Trend | Reversal |
| 12000-12200 | 8968 |