
Market Outlook
THURSAY, DECEMBER 10, 2020
Market Outlook (Closing) as on 10.12.2020
Market closed in negative territory at 45959.88 (-143.62)
NEAR CRUCIAL CLUSTER OF RESISTANCE ZONE: TRAIL TILL IT REVERSES:
BE STOCK SPECIFIC & LIGHT & KEEP PROFIT BOOKING AT REGULAR INTERVELS:
CAN’T RULE OUT POSSIBILTY OF SHARP PROFIT BOOKING FROM HIGHER LEVELS: TRAIL TILL IT REVERSES:
STILL LOOKS LIKE “W ” SHAPE RECOVERY OR PULL BACK RALLY LIKE 1998-2003 STRUCTURE OF MARKET:
MIISING WAVE- V OF BULL MARKET:
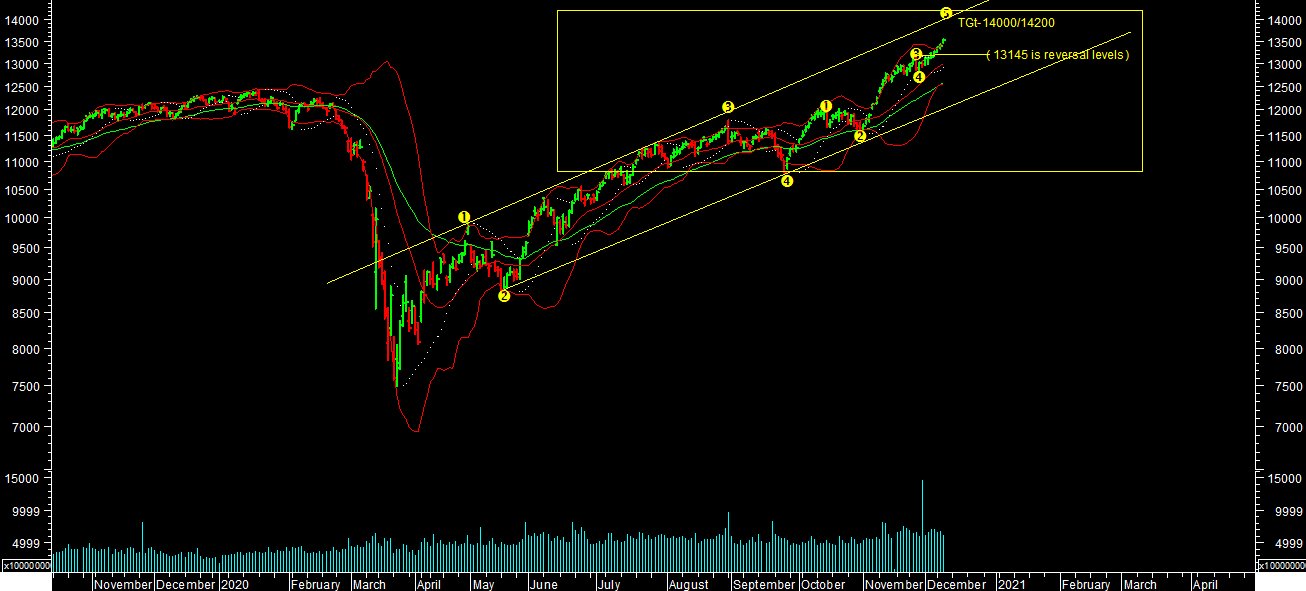
 Market extended further as expected & achieved almost many targets in this entire rally. It made a high of 13548.90 levels on nifty & 46164.10 levels so far. Although it has not given any sign of trend reversal yet but trending towards very crucial cluster of resistance zone. It’s also overbought & over stretched at current levels. One can expect it to extend further towards higher levels of targets till it reverses. One can’t rule out possibility of sharp profit booking from higher levels. One should be stock specific, light & keep profit booking at regular intervals.
It’s now conclusive that we are in final Wave-V of 5 from overall wave counts perspectives. We can further over stretch towards upper end of channel in short term as per chart attached. Such kind of overstretch sharp movement happens generally in wave-V of 5 final wave. It’s now conclusion of missing Wave-V of bull market from medium term perspectives as per chart attached.
It still looks like “W” shape recovery or rally like 1998-2003 structure. And it’s missing Wave-V of higher degree from wave count perspectives. So one can’t rule out sharp correction, once this rally completes, towards further lower levels targets towards 2019 lows or retracement of entire rally from March 2019 lows. So one should be very stock specific in this phase of market.
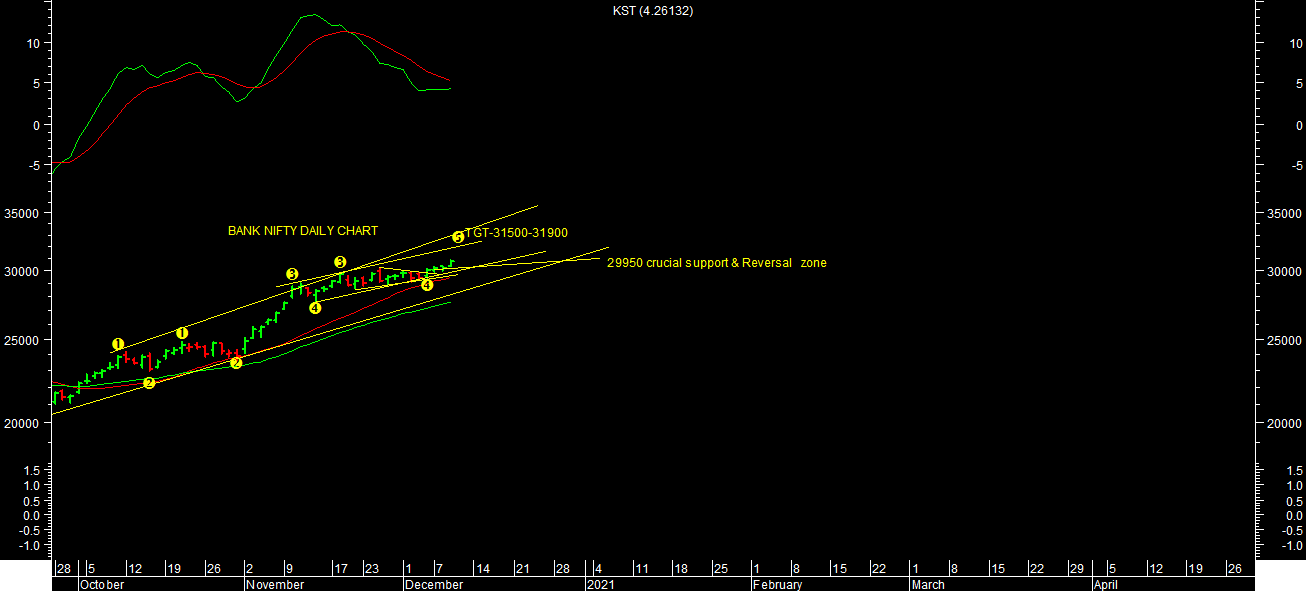
BANK NIFTY is also showing sign of extension in short term. 29950 levels is strong support for short term, till it holds one can expect targets in the range of 31500/31800-32650 levels in short term as per chart attached. 25200 levels is strong support for overall bullish view on bank nifty.
13000 & 13500 is crucial support & Resistance zone respectively for short term from expiry perspectives so far based option open interest data.
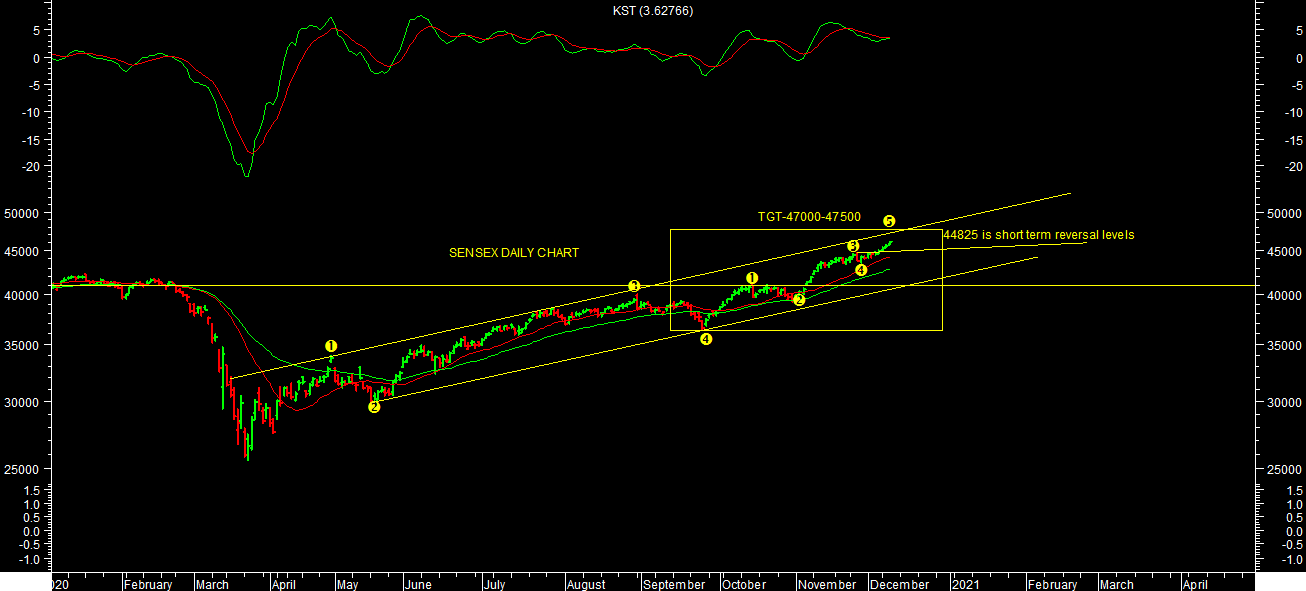
Momentum indicators Daily KST is in SELL & Daily MACD is in BUY indicating volatile trend in short term. One should be stock specific & follow trend with trail stop loss levels till it reverses in short term. Close below short term reversal levels will lead to sharp sell off towards lower levels targets of 12800/12600 levels on nifty & 43580-43000 levels on sensex in short term.
Momentum Perspective:
Weekly KST & WEEKLY MACD both are in BUY. Market is still closed above 20WESM & 40 WEMA. One should wait for price reversal to finally conclude medium term reversal.
Conclusion:
Short Term Trend is UP & Medium term Trend is UP
Trend
Market Outlook (Closing) as on 10.12.2020
Market closed in negative territory at 45959.88 (-143.62)NEAR CRUCIAL CLUSTER OF RESISTANCE ZONE: TRAIL TILL IT REVERSES:
BE STOCK SPECIFIC & LIGHT & KEEP PROFIT BOOKING AT REGULAR INTERVELS:
CAN’T RULE OUT POSSIBILTY OF SHARP PROFIT BOOKING FROM HIGHER LEVELS: TRAIL TILL IT REVERSES:
STILL LOOKS LIKE “W ” SHAPE RECOVERY OR PULL BACK RALLY LIKE 1998-2003 STRUCTURE OF MARKET:
MIISING WAVE- V OF BULL MARKET:
It’s now conclusive that we are in final Wave-V of 5 from overall wave counts perspectives. We can further over stretch towards upper end of channel in short term as per chart attached. Such kind of overstretch sharp movement happens generally in wave-V of 5 final wave. It’s now conclusion of missing Wave-V of bull market from medium term perspectives as per chart attached.
It still looks like “W” shape recovery or rally like 1998-2003 structure. And it’s missing Wave-V of higher degree from wave count perspectives. So one can’t rule out sharp correction, once this rally completes, towards further lower levels targets towards 2019 lows or retracement of entire rally from March 2019 lows. So one should be very stock specific in this phase of market.
BANK NIFTY is also showing sign of extension in short term. 29950 levels is strong support for short term, till it holds one can expect targets in the range of 31500/31800-32650 levels in short term as per chart attached. 25200 levels is strong support for overall bullish view on bank nifty.
13000 & 13500 is crucial support & Resistance zone respectively for short term from expiry perspectives so far based option open interest data.
Momentum indicators Daily KST is in SELL & Daily MACD is in BUY indicating volatile trend in short term. One should be stock specific & follow trend with trail stop loss levels till it reverses in short term. Close below short term reversal levels will lead to sharp sell off towards lower levels targets of 12800/12600 levels on nifty & 43580-43000 levels on sensex in short term.
Momentum Perspective:
Weekly KST & WEEKLY MACD both are in BUY. Market is still closed above 20WESM & 40 WEMA. One should wait for price reversal to finally conclude medium term reversal.Conclusion:
Short Term Trend is UP & Medium term Trend is UP
Trend
| Short Term : | Trend | Reversal |
| 47000-47300 | 44825 | |
| Medium Term : | Trend | Reversal |
| 47000-47300 | 41048 |
| Short Term : | Trend | Reversal |
| 13700 | 13145 | |
| Medium Term : | Trend | Reversal |
| 13900-14100 | 12020 |