
Market Outlook
WEDNESDAY, MARCH 11, 2020
Market Outlook (Closing) as on 11.03.2020
Market closed in positive territory at 35697.40 (+ 62.45)
EXTENDING LOWER WITH STRONG BREAK DOWN :
ANY KIND OF PULL BACK RALLY IS SELLING EXITING OPPORTUNITY: TRAIL TILL IT REVERSES:
CONCLUDING MEDIUM TERM REVERSAL: LOOKS LIKE SHARP WAVE- IV CORRECTION TOWARDS LOWER END OF CHANNEL:
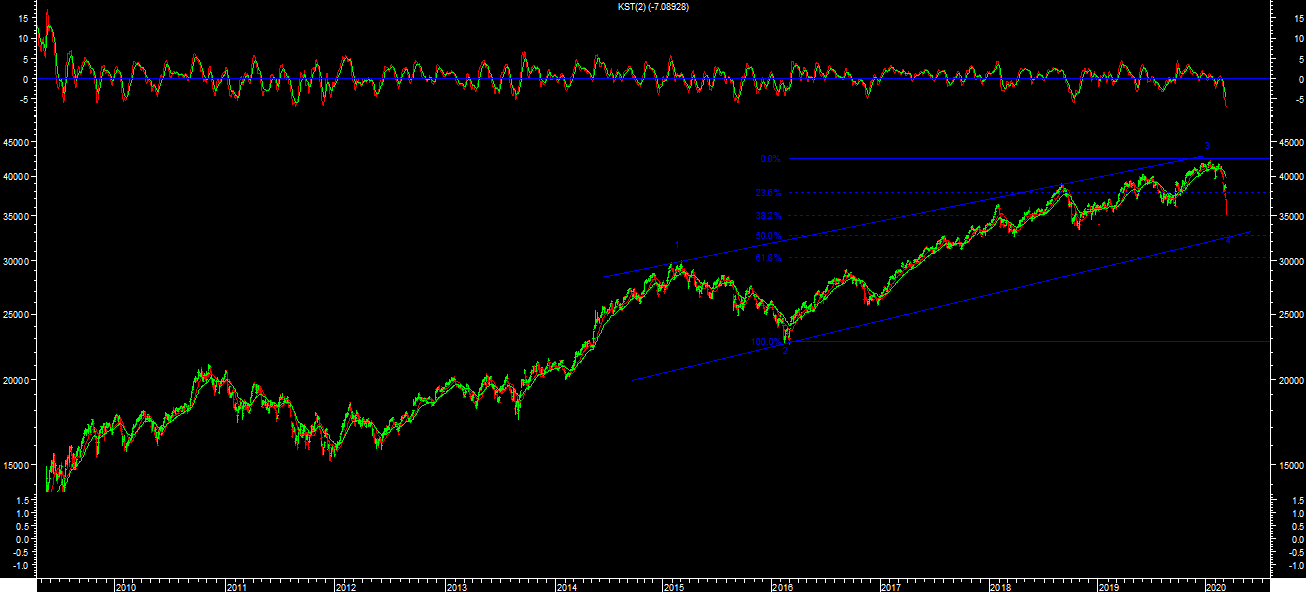
 Market has sharply broken down channel below 10900 levels on nifty & seen sharp sell off with gap down. It made a low of 35109.31 levels on sensex & 10294 levels so far on nifty. It looks like extension of fall towards further lower levels targets till short term reverses. One should use any kind of pull back is selling opportunity till trend reverses.
It looks like wave-IV correction of BULL Market & one can expect further lower levels targets till trend reverses. We will see selling pressure in market till this correction completes or trend reverses.
NIFTY BANK also seen sharp sell off during week. It made a low of 25935.05 levels so far in this correction. 28550 is strong resistance levels in short term, till it holds one can expect lower levels targets till 24500 levels in short term. 29530 levels medium term reversal levels, till it holds one can expect lower levels targets till 23500 levels in these wave-IV Correction.
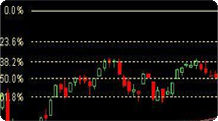
10000 &10500 levels is strong support & resistance levels respectively based on option open interest data so far for current month series . Any kind of such short term pull back rally or consolidation is stock specific selling opportunity till medium term reverses.
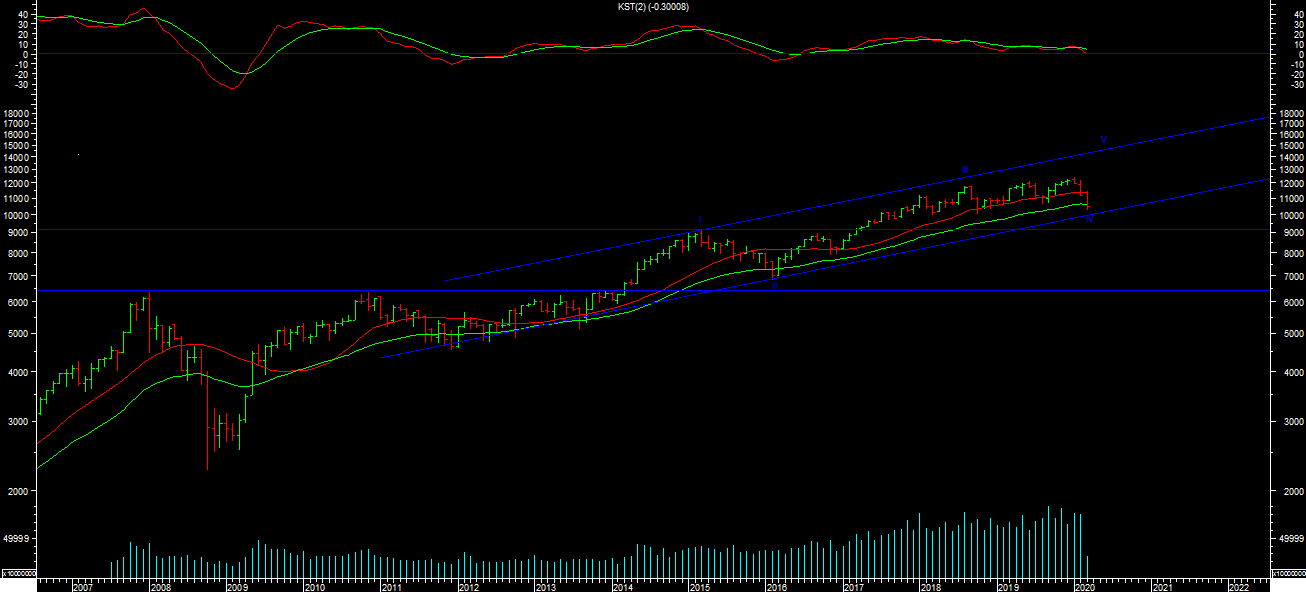
Momentum indicators Daily KST & DAILY MACD both are in SELL indicating volatile trend in short term. One should be stock specific & follow the trend with trail stop loss levels till it reverses.
Momentum Perspective:
Weekly KST Went in to SELL & WEEKLY MACD are in SELL. Market is closed below 20WESM & 40 WEMA. Majority of indicators with Price has confirmed medium term reversal.
Conclusion:
Short Term Trend is DOWN & Medium term Trend is DOWN.
Trend
Market Outlook (Closing) as on 11.03.2020
Market closed in positive territory at 35697.40 (+ 62.45)EXTENDING LOWER WITH STRONG BREAK DOWN :
ANY KIND OF PULL BACK RALLY IS SELLING EXITING OPPORTUNITY: TRAIL TILL IT REVERSES:
CONCLUDING MEDIUM TERM REVERSAL: LOOKS LIKE SHARP WAVE- IV CORRECTION TOWARDS LOWER END OF CHANNEL:
It looks like wave-IV correction of BULL Market & one can expect further lower levels targets till trend reverses. We will see selling pressure in market till this correction completes or trend reverses.
NIFTY BANK also seen sharp sell off during week. It made a low of 25935.05 levels so far in this correction. 28550 is strong resistance levels in short term, till it holds one can expect lower levels targets till 24500 levels in short term. 29530 levels medium term reversal levels, till it holds one can expect lower levels targets till 23500 levels in these wave-IV Correction.
10000 &10500 levels is strong support & resistance levels respectively based on option open interest data so far for current month series . Any kind of such short term pull back rally or consolidation is stock specific selling opportunity till medium term reverses.
Momentum indicators Daily KST & DAILY MACD both are in SELL indicating volatile trend in short term. One should be stock specific & follow the trend with trail stop loss levels till it reverses.
Momentum Perspective:
Weekly KST Went in to SELL & WEEKLY MACD are in SELL. Market is closed below 20WESM & 40 WEMA. Majority of indicators with Price has confirmed medium term reversal.Conclusion:
Short Term Trend is DOWN & Medium term Trend is DOWN.
Trend
| Short Term : | Trend | Reversal |
| 33343 | 37850 | |
| Medium Term : | Trend | Reversal |
| 32700 | 39563 |
| Short Term : | Trend | Reversal |
| 9950 | 11100 | |
| Medium Term : | Trend | Reversal |
| 9750 | 11615 |