
Market Outlook
FRIDAY, OCTOBER 12, 2018
Market Outlook (Closing) as on 12.10.2018
Market closed in positive territory at 34,733.58 (+ 733.58)
LOOKS LIKE HIGH POSSIBILITY OF END OF SHORT TERM WAVE-IV (ABC) MEDIUM TERM CORRECTION: WILL WATCHOUT OTHER EVIDENCES FOR FURTHER CONFIRMATION:
FIRST WEEKLY POSITIVE CLOSE INDICATING PULL BACK RALLY TO CONTINUE TILL SHORT TERM REVERSES :
PARTICIPATION OF BETEAN DOWN BROADER MARKET ( MIDCAP/SMALLCAP) IS IMPORTANT TO WACHOUT FROM MEDIUM TERM PERSPECTIVES HERE ON:
RISK REWARD IS BEST TO BUY STOCK SPECIFIC FROM MEDIUM TERM PERSPECTIVES:
ANY KIND OF SHORT TERM VOLATALITY/ CONSOLIDATION OR DECLINE IS STOCK SPECIFIC BUYING OPPORTUNITY FOR SHORT TO MEDIUM TERM INVESTMENT PERSPECTIVES:TRAIL TILL IT REVERSES:
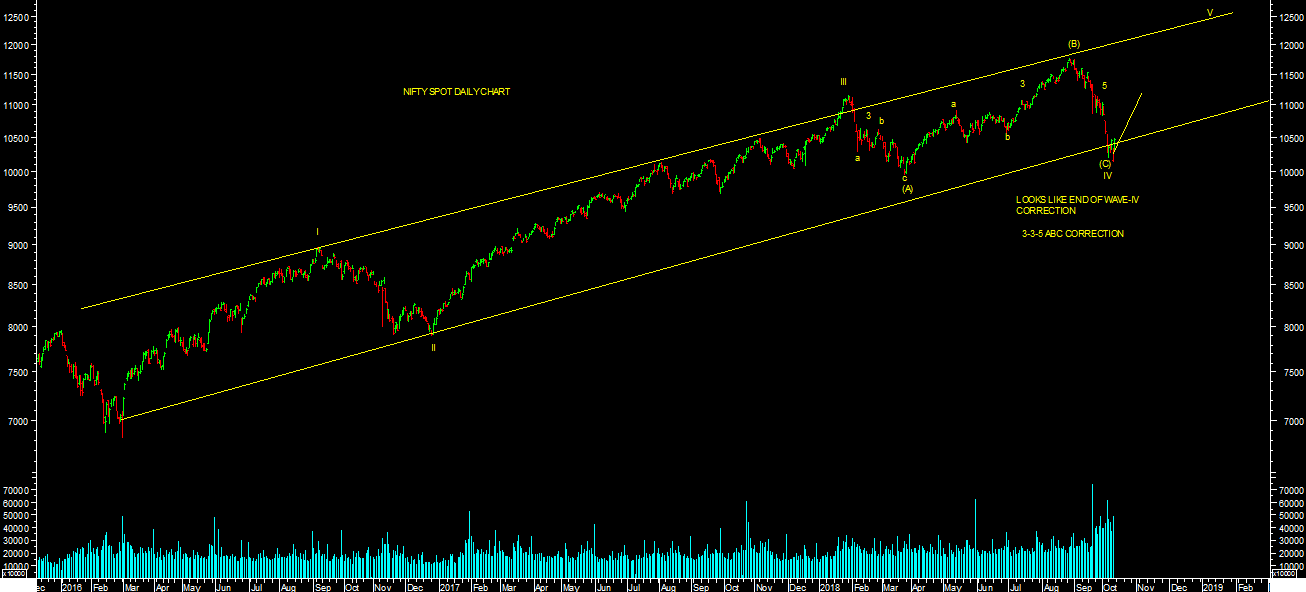
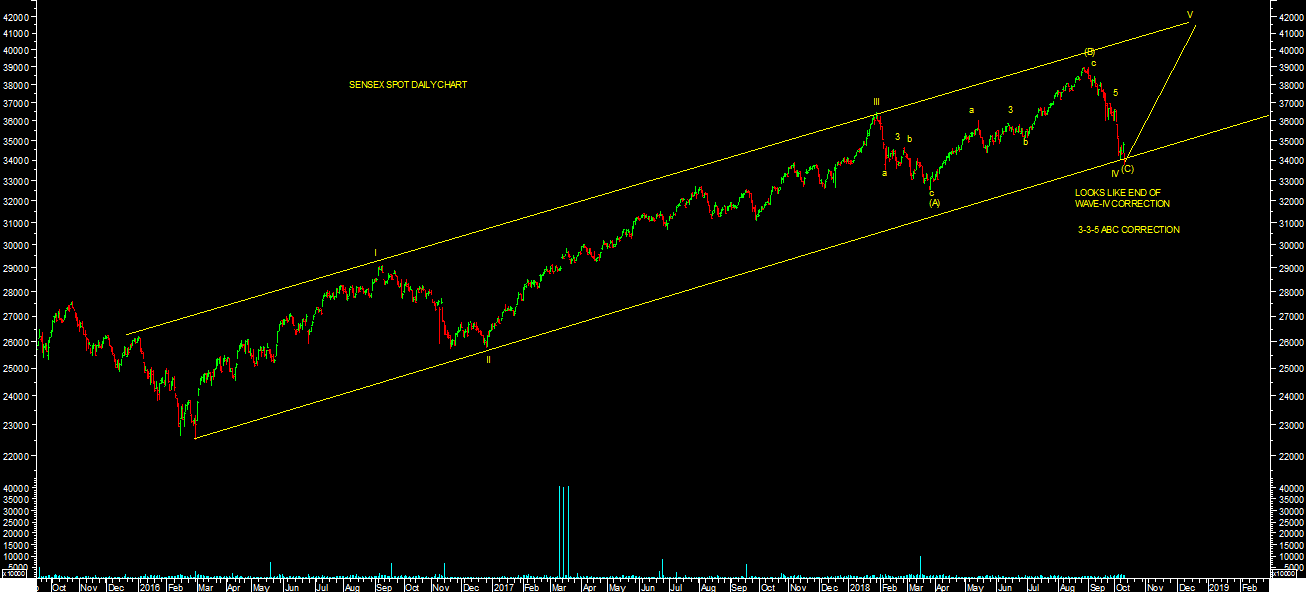
 Market closed 1st weekly positive close after decline of concecutive preceeding five weeks. We have seen sharp sell off across the board in preceeding last five weeks. It made a low of 33723.50 levels in sensex & 10138 levels on nifty in this correction. It sharply reversed from these levels & closed weekly in positive territory. It looks like end of short term correction after 5 wave decline from peak and one can expect pull back rally to continue further towards higher levels targets till short term reverses.
It looks like high possiblity of end of wave-IV (ABC) medium Correction as per chart attached. One should also watchout other evidences for further confirmation of the same. But Risk reward is favourable to BUY stock specific at current levels from medium to long term perspectives, as market is near medium term support/ reversal levels as medntioned below.
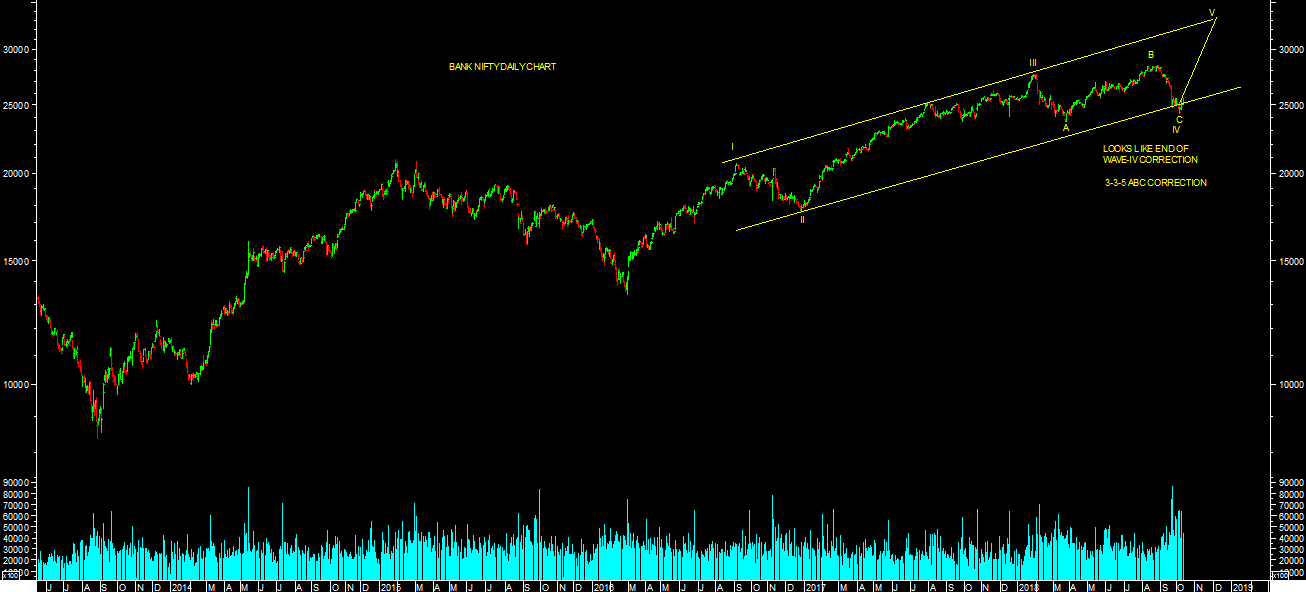
BANK NIFTY also closed 1st weekly positive close after decline of concecutive five weeks. It also looks like end of wave-IV (ABC) medium term correction as per chart attached. It looks like end of short term correction after 5 wave decline from peak and one can expect pull back rally to continue further towards higher levels targets till short term reverses. 24270 is short term support/reversal on bank nifty till it holds one can expect higher levels targets till 26100-26800 levels in short term. 23000 levels is strong support on bank nifty from medium term perspectives till it holds one can expect higher levels targets till 32000-33000 levels in medium term.
10000 & 10500/10800 levels is strong support & resistance levels respectively based on option open interest data for expiry perspectives for current month series. Any kind of such short term correction or consolidation is buying opportunity for medium to long term Investment perspectives till medium term reverses. Participation from betean down broader market midcap & small cap indices is important to watchout from medium term perspectives from here on.
Momentum indicators Daily KST & DAILY MACD both are in sell indicating volatality to continue in short term. One should be stock specific & follow the trend with trail stop loss levels till it reverses. Close below short term reversal levels will lead to furhter continuation of sell off till 9950 levels on nifty & 32483 levels on sensex in short term
Momentum Perspective:
Weekly KST & WEEKLY MACD both Went in to SELL & Its trading below both 20WESM & 40 WEMA . All Medium term Parameters are showing weakness. One should watchout price reversal to finally conclude medium term reversal.
Conclusion:
Short Term Trend is UP & Medium term Trend is UP.
Trend
Market Outlook (Closing) as on 12.10.2018
Market closed in positive territory at 34,733.58 (+ 733.58)LOOKS LIKE HIGH POSSIBILITY OF END OF SHORT TERM WAVE-IV (ABC) MEDIUM TERM CORRECTION: WILL WATCHOUT OTHER EVIDENCES FOR FURTHER CONFIRMATION:
FIRST WEEKLY POSITIVE CLOSE INDICATING PULL BACK RALLY TO CONTINUE TILL SHORT TERM REVERSES :
PARTICIPATION OF BETEAN DOWN BROADER MARKET ( MIDCAP/SMALLCAP) IS IMPORTANT TO WACHOUT FROM MEDIUM TERM PERSPECTIVES HERE ON:
RISK REWARD IS BEST TO BUY STOCK SPECIFIC FROM MEDIUM TERM PERSPECTIVES:
ANY KIND OF SHORT TERM VOLATALITY/ CONSOLIDATION OR DECLINE IS STOCK SPECIFIC BUYING OPPORTUNITY FOR SHORT TO MEDIUM TERM INVESTMENT PERSPECTIVES:TRAIL TILL IT REVERSES:
It looks like high possiblity of end of wave-IV (ABC) medium Correction as per chart attached. One should also watchout other evidences for further confirmation of the same. But Risk reward is favourable to BUY stock specific at current levels from medium to long term perspectives, as market is near medium term support/ reversal levels as medntioned below.
BANK NIFTY also closed 1st weekly positive close after decline of concecutive five weeks. It also looks like end of wave-IV (ABC) medium term correction as per chart attached. It looks like end of short term correction after 5 wave decline from peak and one can expect pull back rally to continue further towards higher levels targets till short term reverses. 24270 is short term support/reversal on bank nifty till it holds one can expect higher levels targets till 26100-26800 levels in short term. 23000 levels is strong support on bank nifty from medium term perspectives till it holds one can expect higher levels targets till 32000-33000 levels in medium term.
10000 & 10500/10800 levels is strong support & resistance levels respectively based on option open interest data for expiry perspectives for current month series. Any kind of such short term correction or consolidation is buying opportunity for medium to long term Investment perspectives till medium term reverses. Participation from betean down broader market midcap & small cap indices is important to watchout from medium term perspectives from here on.
Momentum indicators Daily KST & DAILY MACD both are in sell indicating volatality to continue in short term. One should be stock specific & follow the trend with trail stop loss levels till it reverses. Close below short term reversal levels will lead to furhter continuation of sell off till 9950 levels on nifty & 32483 levels on sensex in short term
Momentum Perspective:
Weekly KST & WEEKLY MACD both Went in to SELL & Its trading below both 20WESM & 40 WEMA . All Medium term Parameters are showing weakness. One should watchout price reversal to finally conclude medium term reversal.Conclusion:
Short Term Trend is UP & Medium term Trend is UP.
Trend
| Short Term : | Trend | Reversal |
| 35900-36500 | 33723 | |
| Medium Term : | Trend | Reversal |
| 43200 | 32483 |
| Short Term : | Trend | Reversal |
| 10800-11100 | 10138 | |
| Medium Term : | Trend | Reversal |
| 12600-12900 | 9951 |