
Market Outlook
FRIDAY, AUGUST 19, 2022
Market Outlook (Closing) as on 19.08.2022
Market closed in negative territory at 59,646.15 (-651.85)
ALL SHORT TERM TARGETS ACHIEVED: TRAIL TILL IT REVERSES
PROFIT BOOKING NEAR FROM HIGHER/MEDIUM TERM REVERSAL LEVELS: NOT ANY CONCLUSION FOR OVERALL TREND STRUCTURE TILL SHORT TERM REVERSES
EITHER END OF ABC WAVE-X PULL BACK RALLY OR WAVE-IV CORRECTION AS PER BULLISH WAVE COUNTS: KEEP A FINGER CROSS FOR BOTH OPTIONS TILL SHORT TERM REVERSES
MEDIUM TO LONG TERM INVESTOR CAN USE THIS CORRECTION FOR STOCK SPECIFIC BUYING OPPORTUNITY: TRAIL TILL IT REVERSES:
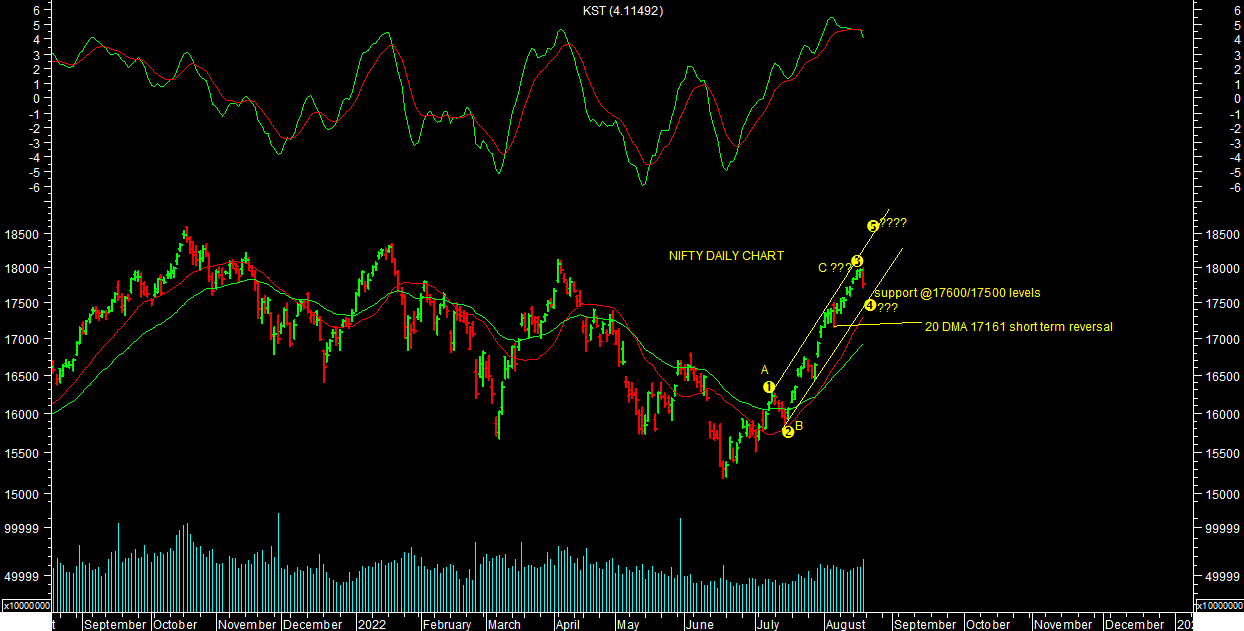
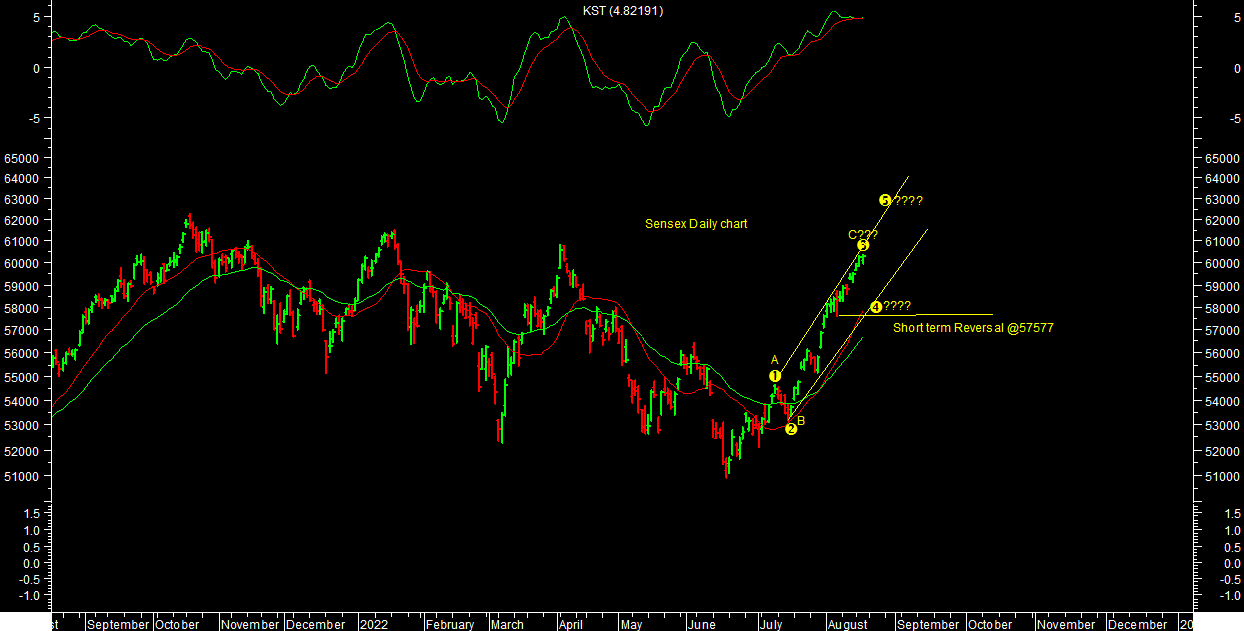
 Market achieved all short term targets levels as expected & sharply witnessed profit booking near from medium term reversal levels at the end of weekly trading session. It made a high of 60355 levels on sensex & 17992.20 levels on nifty. Trader should book profit & be very stock specific at current levels of market till short term reverses. It not conclusive about overall trend structure of market till short term reverses as both bullish & bearish options are open from wave counts perspectives as per chart attached.
It can be completion of Wave-X (ABC) pull back rally as per original view. But by looking at overall structure, magnitude of recent rally from bottom & chart structure of world markets esp. US markets structure do not want to pre-empt or keep any kind of BIAS about markets till short term reverses. It can be small wave-IV correction as per bullish channel set up from overall wave counts perspectives as an alternate as per chart attached. So keep a finger cross & wait for short term reversal levels for finally conclude trend overall reversal.
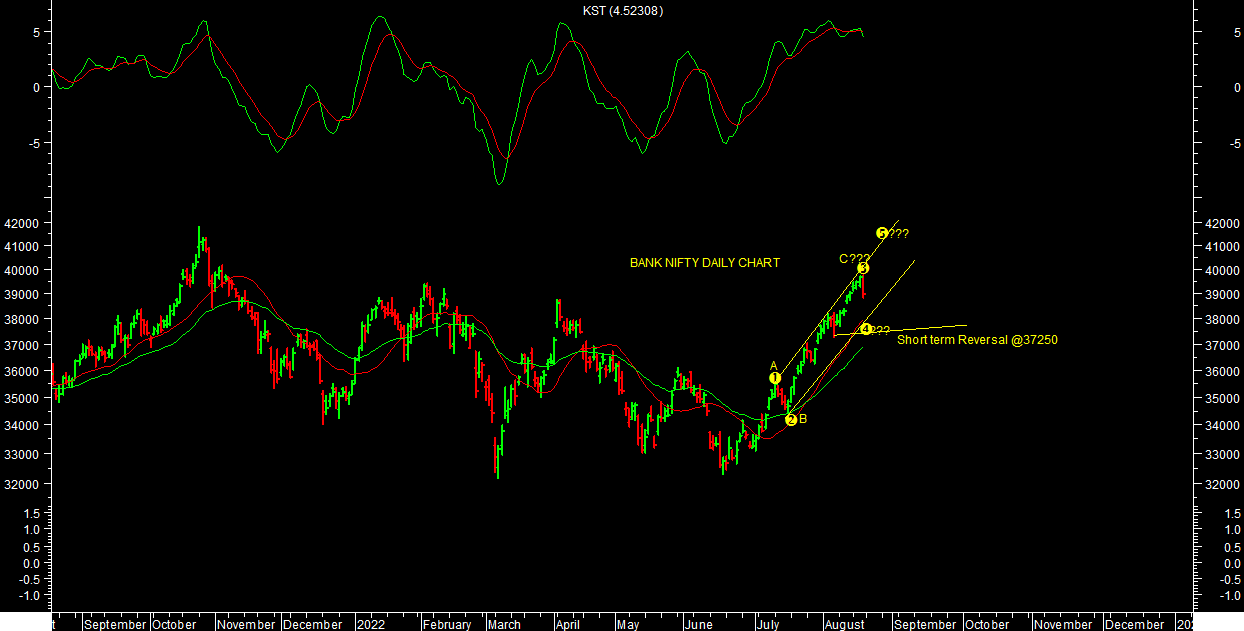
BANK NIFTY also achieved all my short term targets levels & witnessed sharp profit booking near from medium term reversal levels. It made a high of 39759.15 levels. Short term trend remains still UP till it trades above 37250 levels. It can be also similar case like nifty as end of ABC Wave-X pullback rally as per original view & alternatively wave-IV correction of bullish set up. It’s also trading in Bullish channel as per chart attached till its proven otherwise or short term reverses. One should keep a finger cross & watch out for short term reversal levels to finally conclude the same. 39800 are medium term reversal levels to finally conclude the overall trend reversal.
17500/18000 is strong support zone & Resistance zone levels respectively based on option open interest data for current month series so far from expiry perspectives. Market will remain volatile ahead of an expiry next week.
Momentum indicators Daily KST went in to SELL while Daily MACD is still in BUY indicating volatile trend in short term. Trader should be Stock specific & keeps regular profit booking at current levels of market while Investor should use this corrective phase to buy stock specific in tranches in disciplined manner from long term perspectives.
Momentum Perspective:
Weekly KST & Weekly MACD both came in to BUY. Market closed above 20WESM & 40 WEMA. One should watch out for price Reversal to finally conclude Medium term Reversal
Conclusion:
Short Term Trend is UP & Medium term Trend is Down
Trend
Market Outlook (Closing) as on 19.08.2022
Market closed in negative territory at 59,646.15 (-651.85)ALL SHORT TERM TARGETS ACHIEVED: TRAIL TILL IT REVERSES
PROFIT BOOKING NEAR FROM HIGHER/MEDIUM TERM REVERSAL LEVELS: NOT ANY CONCLUSION FOR OVERALL TREND STRUCTURE TILL SHORT TERM REVERSES
EITHER END OF ABC WAVE-X PULL BACK RALLY OR WAVE-IV CORRECTION AS PER BULLISH WAVE COUNTS: KEEP A FINGER CROSS FOR BOTH OPTIONS TILL SHORT TERM REVERSES
MEDIUM TO LONG TERM INVESTOR CAN USE THIS CORRECTION FOR STOCK SPECIFIC BUYING OPPORTUNITY: TRAIL TILL IT REVERSES:
It can be completion of Wave-X (ABC) pull back rally as per original view. But by looking at overall structure, magnitude of recent rally from bottom & chart structure of world markets esp. US markets structure do not want to pre-empt or keep any kind of BIAS about markets till short term reverses. It can be small wave-IV correction as per bullish channel set up from overall wave counts perspectives as an alternate as per chart attached. So keep a finger cross & wait for short term reversal levels for finally conclude trend overall reversal.
BANK NIFTY also achieved all my short term targets levels & witnessed sharp profit booking near from medium term reversal levels. It made a high of 39759.15 levels. Short term trend remains still UP till it trades above 37250 levels. It can be also similar case like nifty as end of ABC Wave-X pullback rally as per original view & alternatively wave-IV correction of bullish set up. It’s also trading in Bullish channel as per chart attached till its proven otherwise or short term reverses. One should keep a finger cross & watch out for short term reversal levels to finally conclude the same. 39800 are medium term reversal levels to finally conclude the overall trend reversal.
17500/18000 is strong support zone & Resistance zone levels respectively based on option open interest data for current month series so far from expiry perspectives. Market will remain volatile ahead of an expiry next week.
Momentum indicators Daily KST went in to SELL while Daily MACD is still in BUY indicating volatile trend in short term. Trader should be Stock specific & keeps regular profit booking at current levels of market while Investor should use this corrective phase to buy stock specific in tranches in disciplined manner from long term perspectives.
Momentum Perspective:
Weekly KST & Weekly MACD both came in to BUY. Market closed above 20WESM & 40 WEMA. One should watch out for price Reversal to finally conclude Medium term ReversalConclusion:
Short Term Trend is UP & Medium term Trend is Down
Trend
| Short Term : | Trend | Reversal |
| 60000/60400 | 58400 | |
| Medium Term : | Trend | Reversal |
| 47200-46500 | 60400 |
| Short Term : | Trend | Reversal |
| 17900/18000 | 17161 | |
| Medium Term : | Trend | Reversal |
| 14200-13700 | 18000 |