
Market Outlook
FRIDAY, SEPTEMBER 21, 2018
Market Outlook (Closing) as on 21.09.2018
Market closed in negative territory at 36,841.60 (- 279.62)
BULL TRAP WITH 3rd CONCECUTIVE WEEKLY NEGATIVE CLOSE:
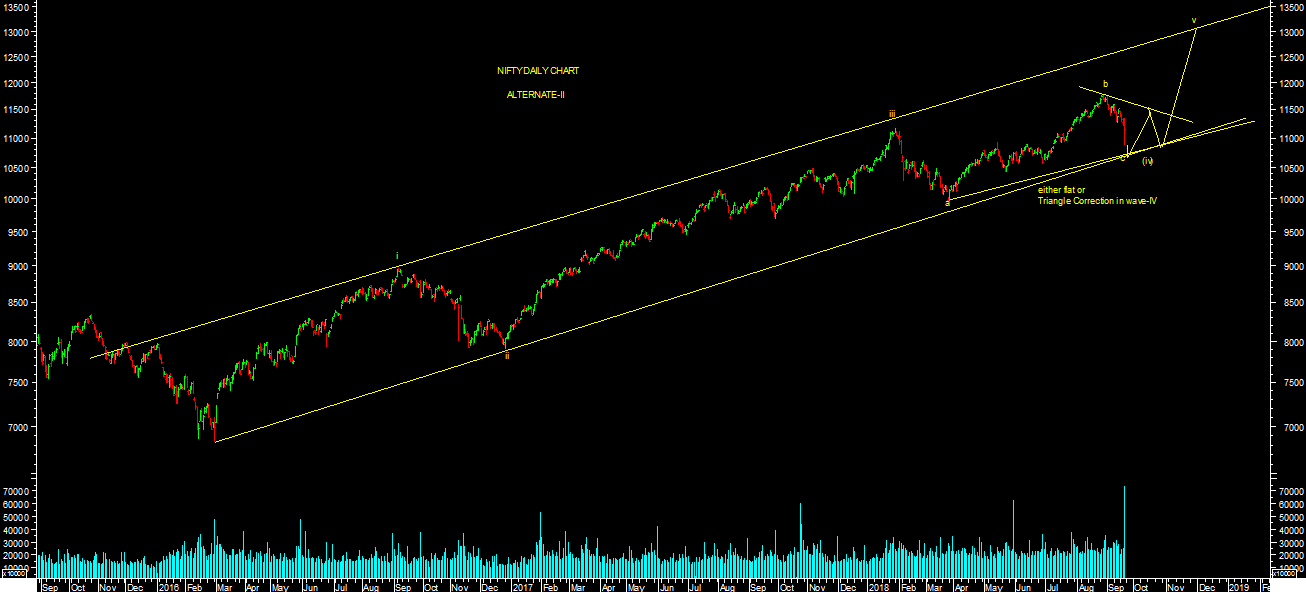
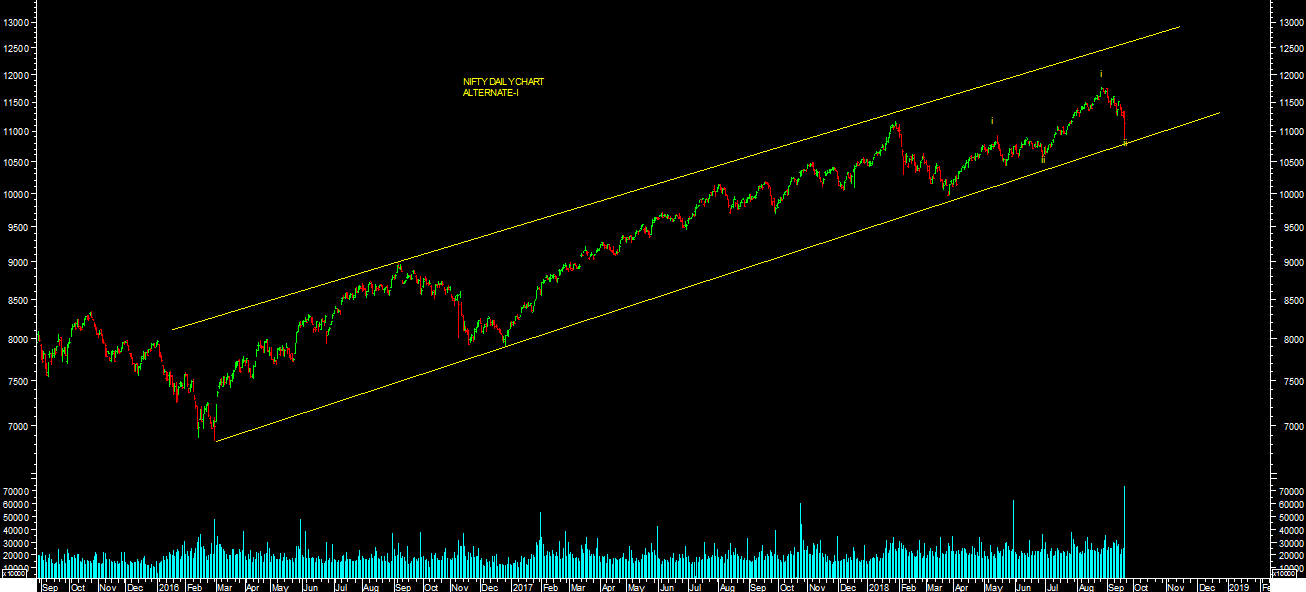
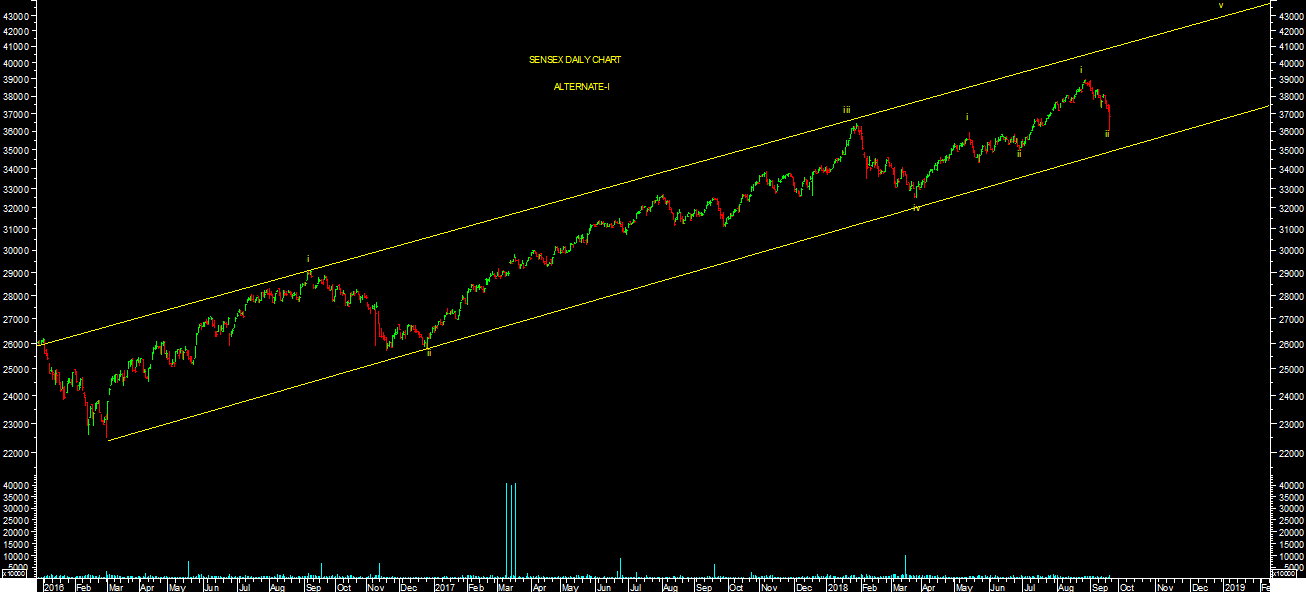
SURPRISE WAVE-IV EITHER FLAT OR TRIANGLE IS CORRECTION STILL ON, BEYOND ANTICIPATION: TRAIL TILL IT REVERSES:
ANY KIND OF SHORT TERM VOLTALITY/ CONSOLIDATION OR DECLINE IS STOCK SPECIFIC BUYING OPPORTUNITY FOR SHORT TO MEDIUM TERM INVESTMENT PERSPECTIVES:TRAIL TILL IT REVERSES:
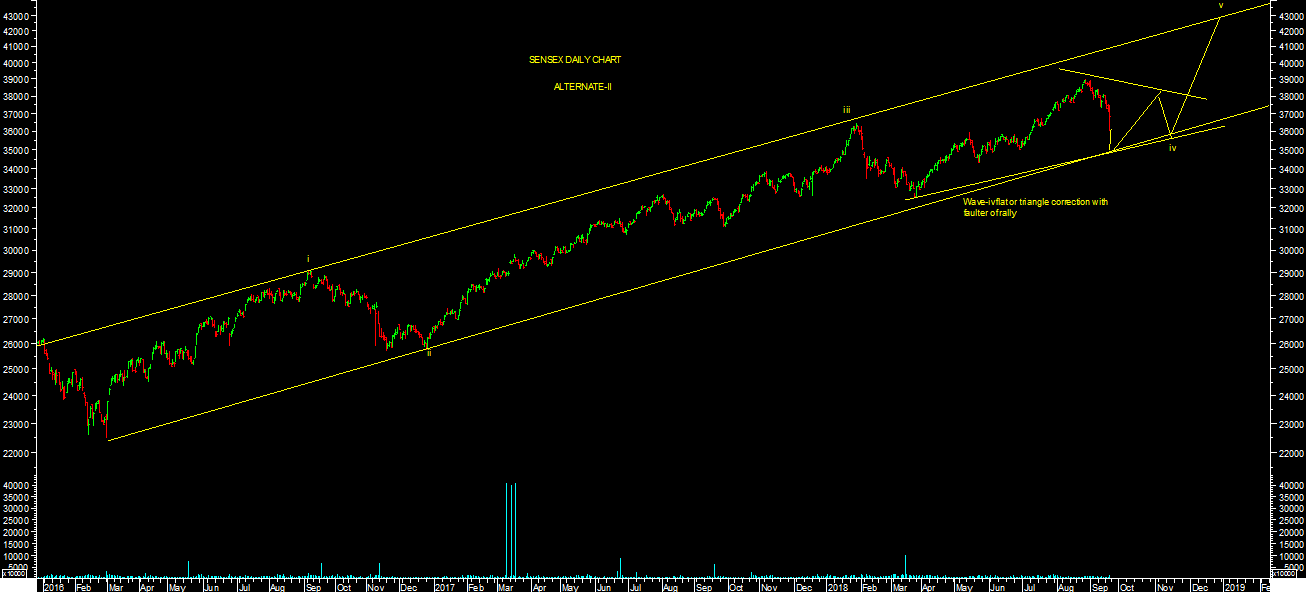
 Market closed 3rd concecutive week in negative territory. It has fallen sharply beyond anticipation during week. It has completely deteriorated wave count structure on main indices as expected. It has made a low of 10866.45 levels on nifty & 35993.64 levels on sensex so far in this correction. Break of these lows will lead to extension of correction for furhter lower levels targets as mentioend below in short term. Till that market may trade in range with high voltality. Short term out looks for market remains negative till it finally confims end of these wave-IV short term correction.
It looks like either flat or triangular structure as per short term wave count chart attached in these wave-IV short term correction. It can be possible to take as impulsive struacture as well as an another altenate as per chart attached. But these correction came as surprise beyond anticipation to me. Therefore, I would like to wait till this correction ends or voltality settles to finally conclude any kind of preffered wave counts.
MIDCAP & SMALL CAP Indices witnessed sharp sell off & it has broken recent lows in this corrrection. It remained underperformer & still not bottom out as per my earleir expectation. One should closely watchout broader makret behavior for reversal of short term trend.
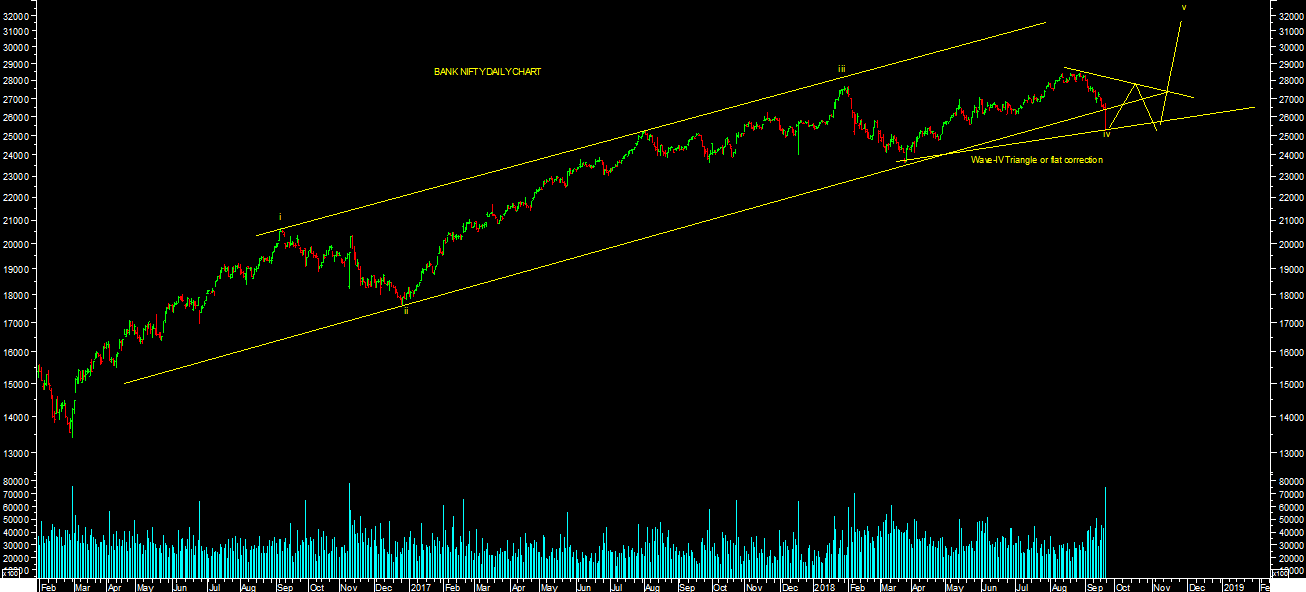
BANK NIFTY also closed 3rd concectuive week in negative territory. It also made a bull trap at higher levels beyond anticipation & its still in wave-IV either flat or triangular correction as per chart attached. It looks much more clear either flar or trianlge correction in wave-IV on bank nifty. It has made a low of 25228.10 levels so far in this correction. Break of these low will lead to extension of these correction for further lower levels targets till 24700-23600 levels in short term. Till that it may reamin in range with high volatality. Short term outlook for bank nifty remains negative till it trades below 27770 levels in short term. While medium term out look for bank nifty still remains positive till it trades above 23133 levels & expecting targets in the range of 32000-33000 levels in medium term.
11000 & 11400 levels is strong support & resistance levels respectively based on option open interest data for expiry perspectives for expiry perspectives next week. Any kind of such short term correction or consolidation is buying opportunity for medium to long term Investment perspectives till medium term reverses.
Momentum indicators Daily KST & DAILY MACD both are in sell supporting short term trend. One should be stock specific & follow the trend with trail stop loss levels till it reverses. Close above short term reversal levels will fianlly confirm end of these correction & rally towards higher levels targets as mentioend below in medium term.lead to sharp correction till 10500-10400 levels on nifty & 34900-34300 levels on sensex in short term.
Momentum Perspective:
Weekly KST & WEEKLY MACD both are in BUY & Its trading above both 20WESM & 40 WEMA . All Medium term Parameters are showing strength.One can expect market to trend towards higher level targets in medium term. Any kind of short term correction or consolidation in buying opportunity for medium to long term Investment perspectives till it reverses.
Conclusion:
Short Term Trend is DOWN & Medium term Trend is UP.
Trend
Market Outlook (Closing) as on 21.09.2018
Market closed in negative territory at 36,841.60 (- 279.62)BULL TRAP WITH 3rd CONCECUTIVE WEEKLY NEGATIVE CLOSE:
SURPRISE WAVE-IV EITHER FLAT OR TRIANGLE IS CORRECTION STILL ON, BEYOND ANTICIPATION: TRAIL TILL IT REVERSES:
ANY KIND OF SHORT TERM VOLTALITY/ CONSOLIDATION OR DECLINE IS STOCK SPECIFIC BUYING OPPORTUNITY FOR SHORT TO MEDIUM TERM INVESTMENT PERSPECTIVES:TRAIL TILL IT REVERSES:
It looks like either flat or triangular structure as per short term wave count chart attached in these wave-IV short term correction. It can be possible to take as impulsive struacture as well as an another altenate as per chart attached. But these correction came as surprise beyond anticipation to me. Therefore, I would like to wait till this correction ends or voltality settles to finally conclude any kind of preffered wave counts.
MIDCAP & SMALL CAP Indices witnessed sharp sell off & it has broken recent lows in this corrrection. It remained underperformer & still not bottom out as per my earleir expectation. One should closely watchout broader makret behavior for reversal of short term trend.
BANK NIFTY also closed 3rd concectuive week in negative territory. It also made a bull trap at higher levels beyond anticipation & its still in wave-IV either flat or triangular correction as per chart attached. It looks much more clear either flar or trianlge correction in wave-IV on bank nifty. It has made a low of 25228.10 levels so far in this correction. Break of these low will lead to extension of these correction for further lower levels targets till 24700-23600 levels in short term. Till that it may reamin in range with high volatality. Short term outlook for bank nifty remains negative till it trades below 27770 levels in short term. While medium term out look for bank nifty still remains positive till it trades above 23133 levels & expecting targets in the range of 32000-33000 levels in medium term.
11000 & 11400 levels is strong support & resistance levels respectively based on option open interest data for expiry perspectives for expiry perspectives next week. Any kind of such short term correction or consolidation is buying opportunity for medium to long term Investment perspectives till medium term reverses.
Momentum indicators Daily KST & DAILY MACD both are in sell supporting short term trend. One should be stock specific & follow the trend with trail stop loss levels till it reverses. Close above short term reversal levels will fianlly confirm end of these correction & rally towards higher levels targets as mentioend below in medium term.lead to sharp correction till 10500-10400 levels on nifty & 34900-34300 levels on sensex in short term.
Momentum Perspective:
Weekly KST & WEEKLY MACD both are in BUY & Its trading above both 20WESM & 40 WEMA . All Medium term Parameters are showing strength.One can expect market to trend towards higher level targets in medium term. Any kind of short term correction or consolidation in buying opportunity for medium to long term Investment perspectives till it reverses.Conclusion:
Short Term Trend is DOWN & Medium term Trend is UP.
Trend
| Short Term : | Trend | Reversal |
| 35600-35200 | 38422 | |
| Medium Term : | Trend | Reversal |
| 43200 | 32483 |
| Short Term : | Trend | Reversal |
| 10700-10550 | 11603 | |
| Medium Term : | Trend | Reversal |
| 12600-12900 | 9951 |