
Market Outlook
FRIDAY, JUNE 22, 2018
Market Outlook (Closing) as on 22.06.2018
Market closed in positive territory at 35,689.60 (+257.21)
TRADING IN CHANNEL: TRAIL TILL IT REVERSES:
BROKEN OUT OF CONSOLIDATION, LOOKS LIKE HIGH POSSIBILITY OF TREND WITH MOMENTUM ON UPSIDE FROM HERE ON:
BSE 500 INDEX LOOKS COMPLETED BULLISH TRINGULAR STRUCTURE IN WAVE-IV, INDICATING HIGH POSSIBILITY OF BROADER MARKET TO PARTICIPATE IN RALLY FROM HERE ON:
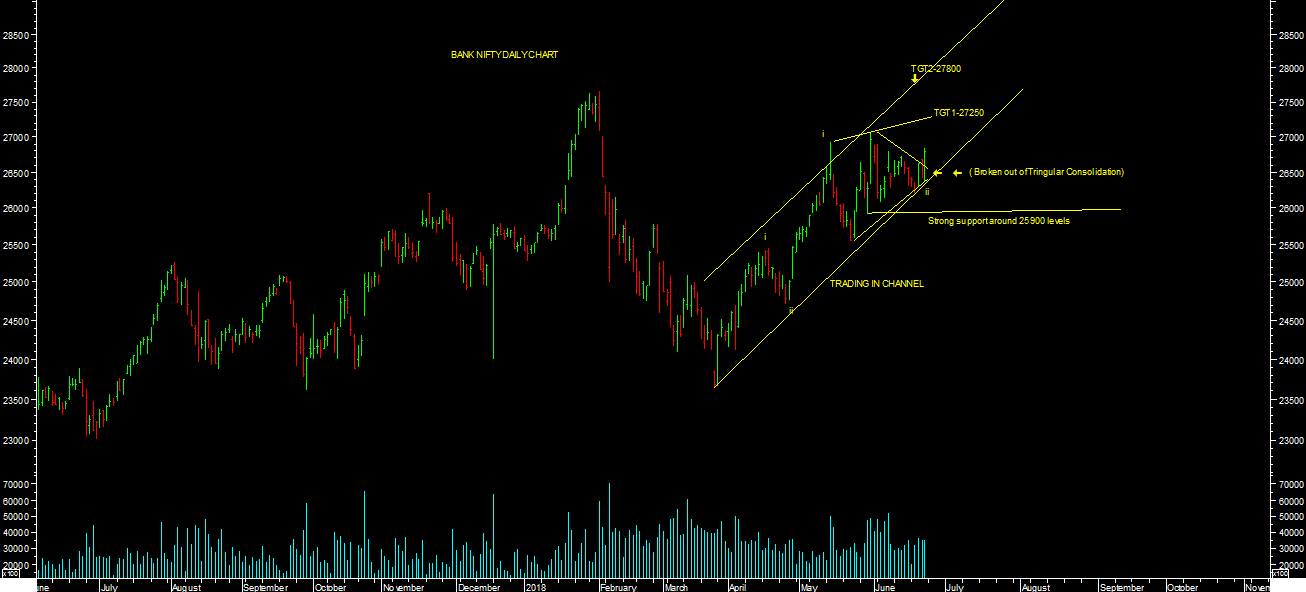
BANK NIFTY CONTINUE TO OUTPERFORM IN RALLY AHEAD :
ANY KIND OF SHORT TERM VOLTALITY/ CONSOLIDATION OR DECLINE IS STOCK SPECIFIC BUYING OPPORTUNITY FOR SHORT TO MEDIUM TERM INVESTMENT PERSPECTIVES:TRAIL TILL IT REVERSES:
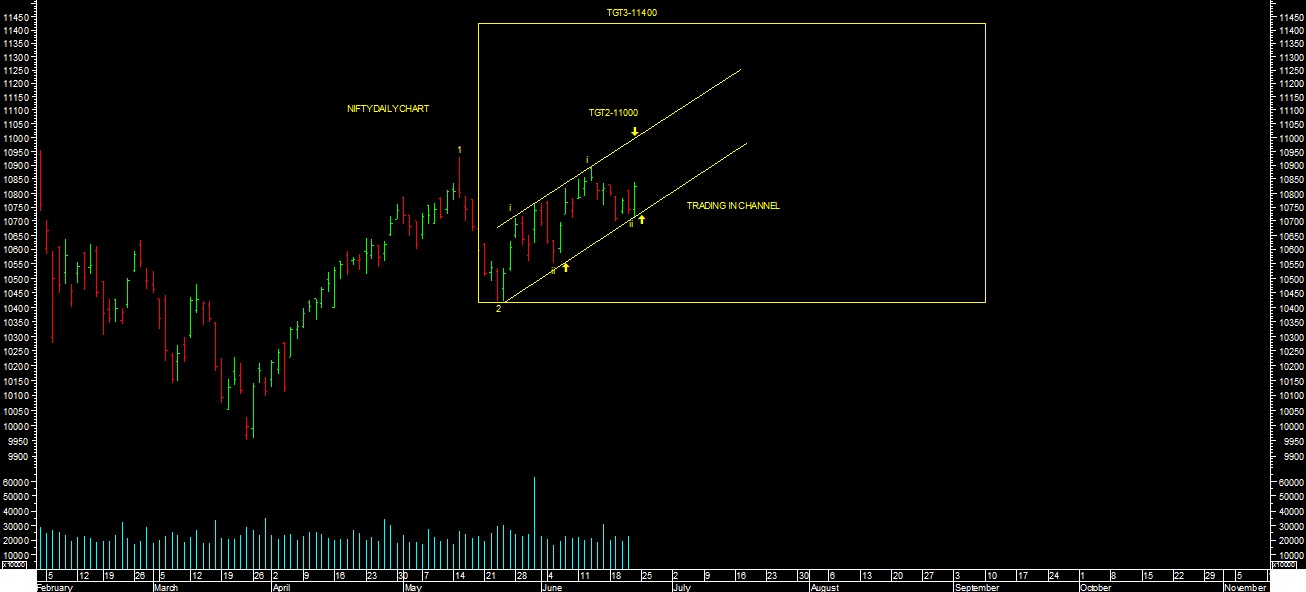
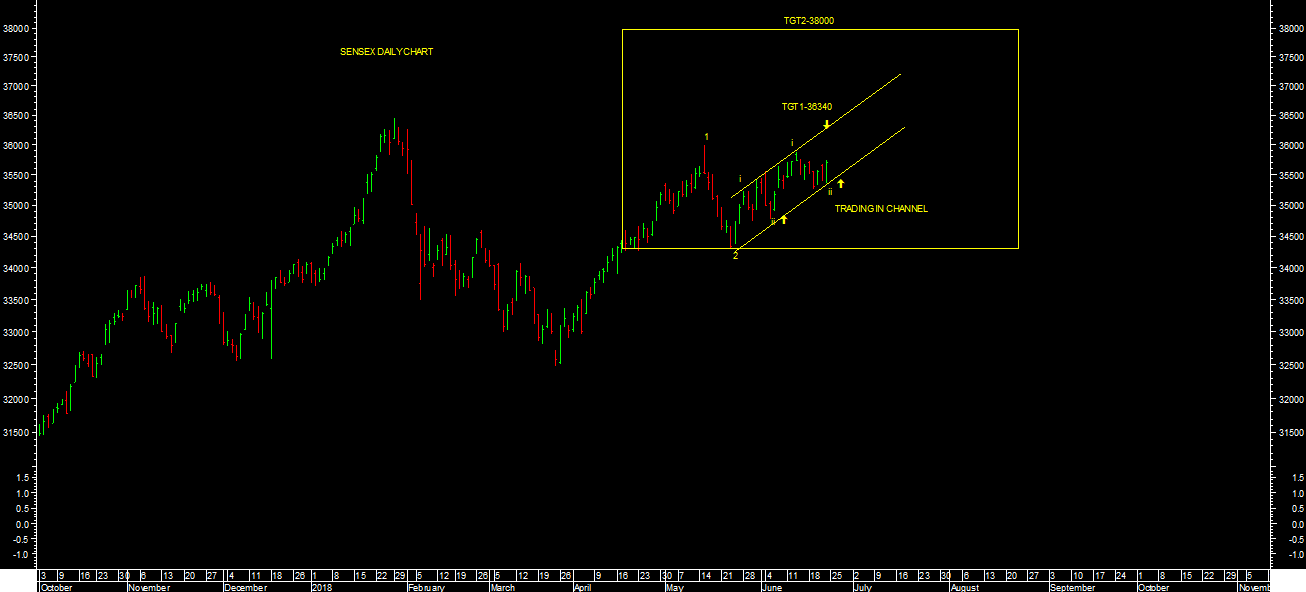
 Market closed 5th concecuitve week in positive territory. It slow but steady extending on upside as expecting. Its trading in channel as per daily chart attached. It has broken out of consolidation on upside at the end of weekly trading as expected. One should expect market to trend till upper end of channel towards higher levels targets as mentioned in short term. Any kind of decline or short term consolidation is stock specific buying opportunity till short term reverses.
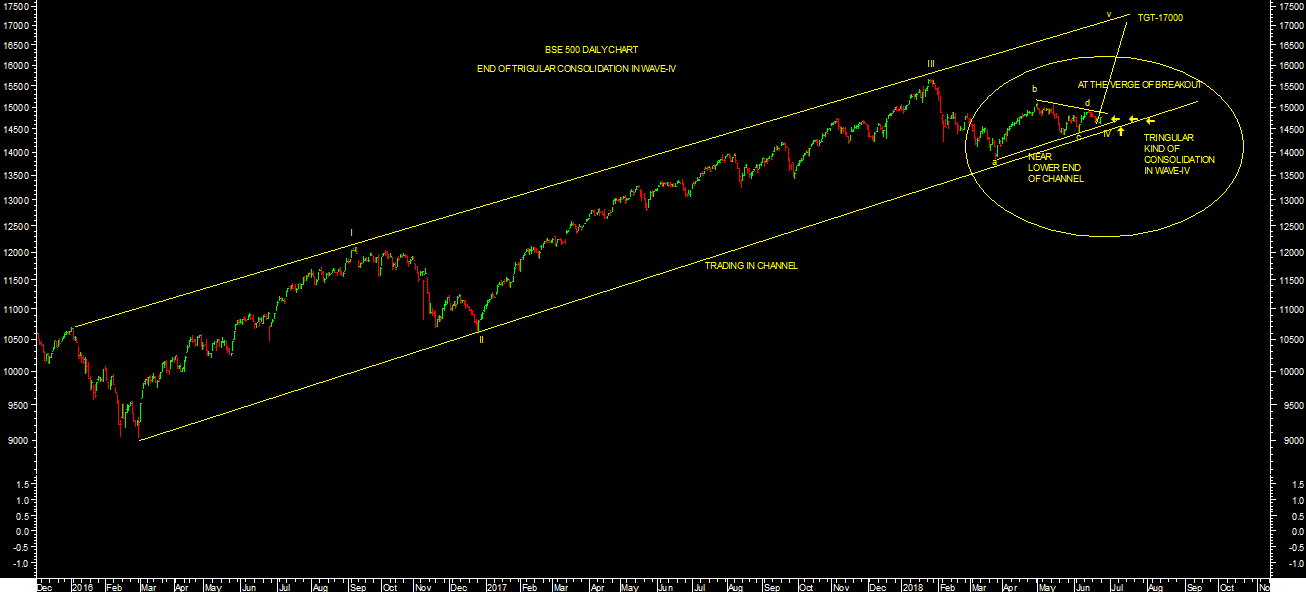
BSE 500 index looks completed Bullish Tringular kind of strucutre in wave-4 as per chart attached. Its also trading in channel as per chart attached. And its almost at lower end of channel as per chart attached. One can expect strong break out on BSE 500 from this consoldation in coming trading session. One can expect higher levels targets till 17000 levels in short to medium term for this index. It also indicating broader market to participate in rally from here on and also sharp revival in quality beaten down stocks of midcap & small cap index.
BANK NIFTY closed weekly in positive territory. Its outperforming in short term. Its also trading in channel as per chart attached. It also broken out of trigular kind of consoldation structure in short term as per daily chart attached. 25900 levels is strong support for bank nifty for short term, till it holds one can exepct higher levels targets till target1-27250 & target2-27800 levels in short term & further above 29600-30000 levels in medium term. Any kind of decline is also buying opportunity for bank nifty for short to medium term perspectives.
10600 & 11000 levels is strong support & resistance levels range respectively based on option open interest data for expiry perspectives next week. By looking at current structure, I feel market is going to surpass all time high soon on main indices & this rally will have time wise consolidation rather than price wise correction in short term. Any kind of such short term correction or consolidation is buying opportunity for medium to long term Investment perspectives till medium term reverses.
Momentum indicators Daily KST & DAILY MACD both went in to SELL indicating volatality in short term. One should be stock specific & follow the trend with trail stop loss levels till it reverses. Close below short term reversal levels will lead to sharp correction till 10300-10200 levels on nifty & 33600 levels on sensex in short term.
Momentum Perspective:
Weekly KST & WEEKLY MACD both are in BUY & Its trading above both 20WESM & 40 WEMA . All Medium term Parameters are showing strength.One can expect market to trend towards higher level targets in medium term. Any kind of short term correction or consolidation in buying opportunity for medium to long term Investment perspectives till it reverses.
Conclusion:
Short Term Trend is UP & Medium term Trend is UP.
Trend
Market Outlook (Closing) as on 22.06.2018
Market closed in positive territory at 35,689.60 (+257.21)TRADING IN CHANNEL: TRAIL TILL IT REVERSES:
BROKEN OUT OF CONSOLIDATION, LOOKS LIKE HIGH POSSIBILITY OF TREND WITH MOMENTUM ON UPSIDE FROM HERE ON:
BSE 500 INDEX LOOKS COMPLETED BULLISH TRINGULAR STRUCTURE IN WAVE-IV, INDICATING HIGH POSSIBILITY OF BROADER MARKET TO PARTICIPATE IN RALLY FROM HERE ON:
BANK NIFTY CONTINUE TO OUTPERFORM IN RALLY AHEAD :
ANY KIND OF SHORT TERM VOLTALITY/ CONSOLIDATION OR DECLINE IS STOCK SPECIFIC BUYING OPPORTUNITY FOR SHORT TO MEDIUM TERM INVESTMENT PERSPECTIVES:TRAIL TILL IT REVERSES:
BSE 500 index looks completed Bullish Tringular kind of strucutre in wave-4 as per chart attached. Its also trading in channel as per chart attached. And its almost at lower end of channel as per chart attached. One can expect strong break out on BSE 500 from this consoldation in coming trading session. One can expect higher levels targets till 17000 levels in short to medium term for this index. It also indicating broader market to participate in rally from here on and also sharp revival in quality beaten down stocks of midcap & small cap index.
BANK NIFTY closed weekly in positive territory. Its outperforming in short term. Its also trading in channel as per chart attached. It also broken out of trigular kind of consoldation structure in short term as per daily chart attached. 25900 levels is strong support for bank nifty for short term, till it holds one can exepct higher levels targets till target1-27250 & target2-27800 levels in short term & further above 29600-30000 levels in medium term. Any kind of decline is also buying opportunity for bank nifty for short to medium term perspectives.
10600 & 11000 levels is strong support & resistance levels range respectively based on option open interest data for expiry perspectives next week. By looking at current structure, I feel market is going to surpass all time high soon on main indices & this rally will have time wise consolidation rather than price wise correction in short term. Any kind of such short term correction or consolidation is buying opportunity for medium to long term Investment perspectives till medium term reverses.
Momentum indicators Daily KST & DAILY MACD both went in to SELL indicating volatality in short term. One should be stock specific & follow the trend with trail stop loss levels till it reverses. Close below short term reversal levels will lead to sharp correction till 10300-10200 levels on nifty & 33600 levels on sensex in short term.
Momentum Perspective:
Weekly KST & WEEKLY MACD both are in BUY & Its trading above both 20WESM & 40 WEMA . All Medium term Parameters are showing strength.One can expect market to trend towards higher level targets in medium term. Any kind of short term correction or consolidation in buying opportunity for medium to long term Investment perspectives till it reverses.Conclusion:
Short Term Trend is UP & Medium term Trend is UP.
Trend
| Short Term : | Trend | Reversal |
| 36300-36500 | 34302 | |
| Medium Term : | Trend | Reversal |
| 38200-38500 | 29077 |
| Short Term : | Trend | Reversal |
| 11000-11200 | 10417 | |
| Medium Term : | Trend | Reversal |
| 12000-12200 | 8968 |