
Market Outlook
MONDAY, JULY 22, 2019
Market Outlook (Closing) as on 22.07.2019
Market closed in negative territory at 38, 031.13 (- 305.88)
SHORT TERM TARGETS ACHIEVED: TRAIL TILL IT REVERSES:
BROKEN ON DOWN SIDE FROM CHANNEL: LOOKS LIKE EXTENSION CASE FURTHER ON DOWN SIDE IN SHORT TERM:
ANY KIND OF SHORT TERM VOLATALITY/ CONSOLIDATION OR DECLINE IS STOCK SPECIFIC BUYING OPPORTUNITY FOR SHORT TO MEDIUM TERM INVESTMENT PERSPECTIVES:TRAIL TILL IT REVERSES:
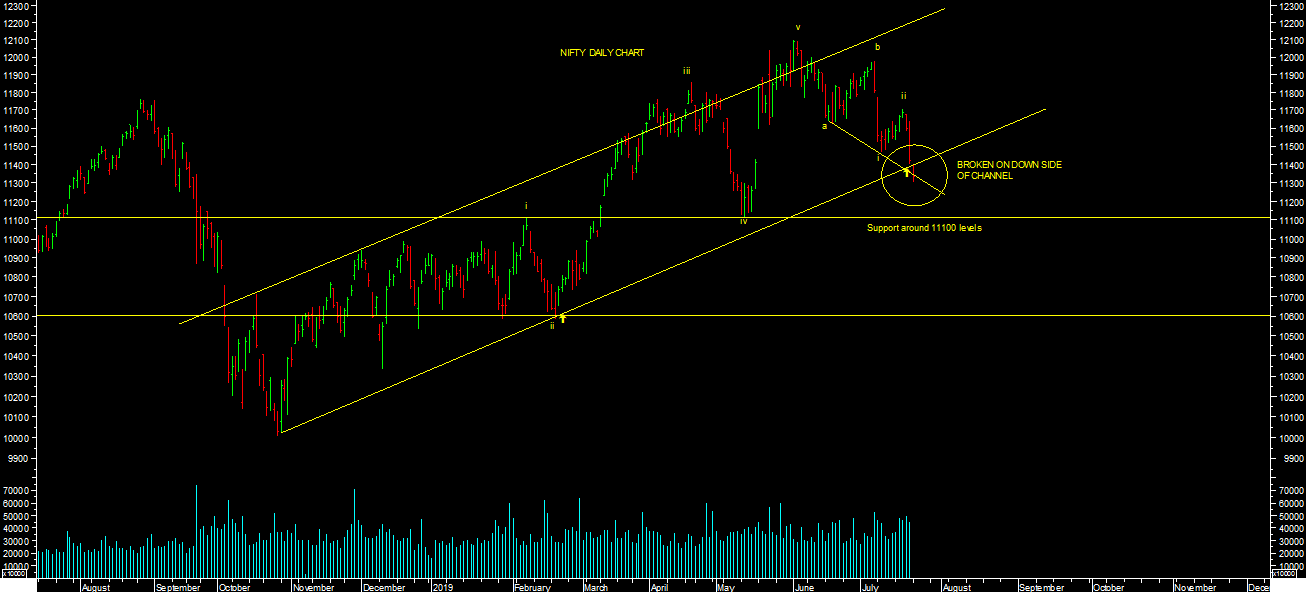
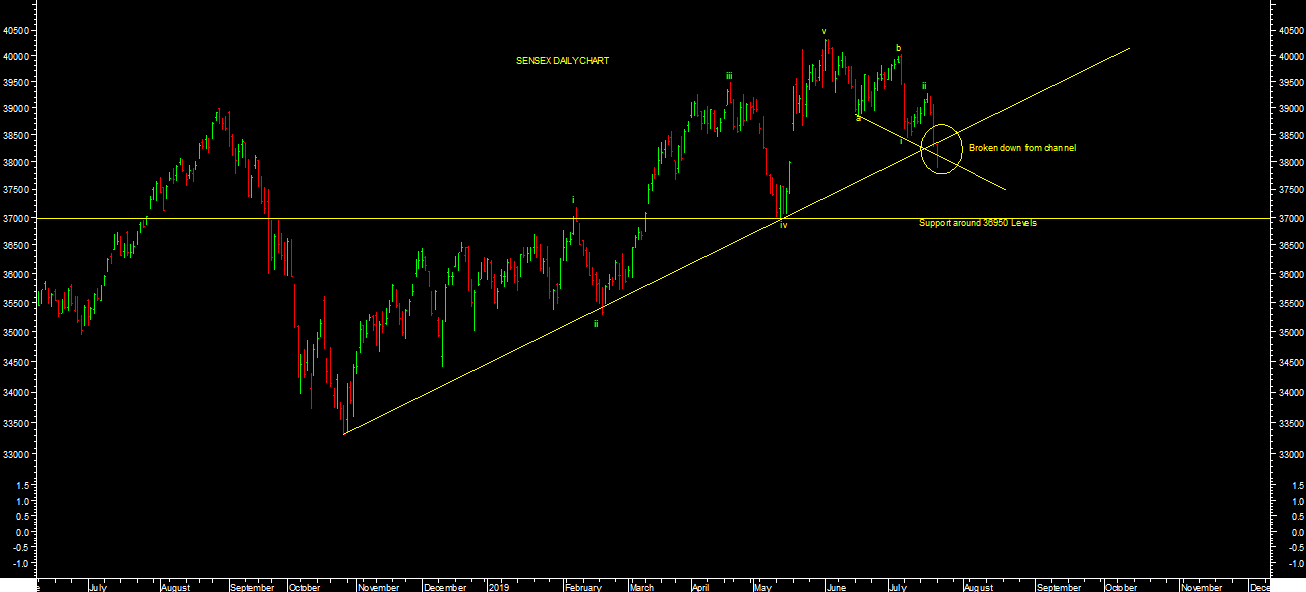
 Market extended short term correction & achieved my short term targets levels near recent lows as expected earlier. It made a low of 11301.30 levels on nifty & 37891.59 levels on sensex so far in this correction. It has broken down from channel as per chart attached. It looks like extension of correction further towards reveised lower levels targets in short term. Any kind of pull back rally is stock specific selling opportunity for revised lower levels targets in short term from trading persepctives till it reverses.
As mentioned earlier, We have seen sharp correction after completion of wave-5 near recent high of 12103.05 levels on nifty & 40,312.07 levels on sensex. We are in corrective mode in short term, although overall wave count is still not conclusive at current levels of market but its divergence market is still not TOP OUT from medium to long term perspectives. Therefore, Any kind of such correction is stock specific buying opportunity from medium to long term persepctives.
Broader market such as midcap & small cap indices is almost near october 2018 lows & Strongly underperforming in last 18 months inspite of being main indices such as nifty/sensex & Bank nifty is hitting all time high levels. we are seeing these divergence between main indices & broader market. I am anitcipating these divergence to end soon but its still not happening, its warning sign at current levels of market. It has to catch up & participate now for my over all medium to long term bullish trend of market. One should closely watchout broader market behavior at current levels of market.
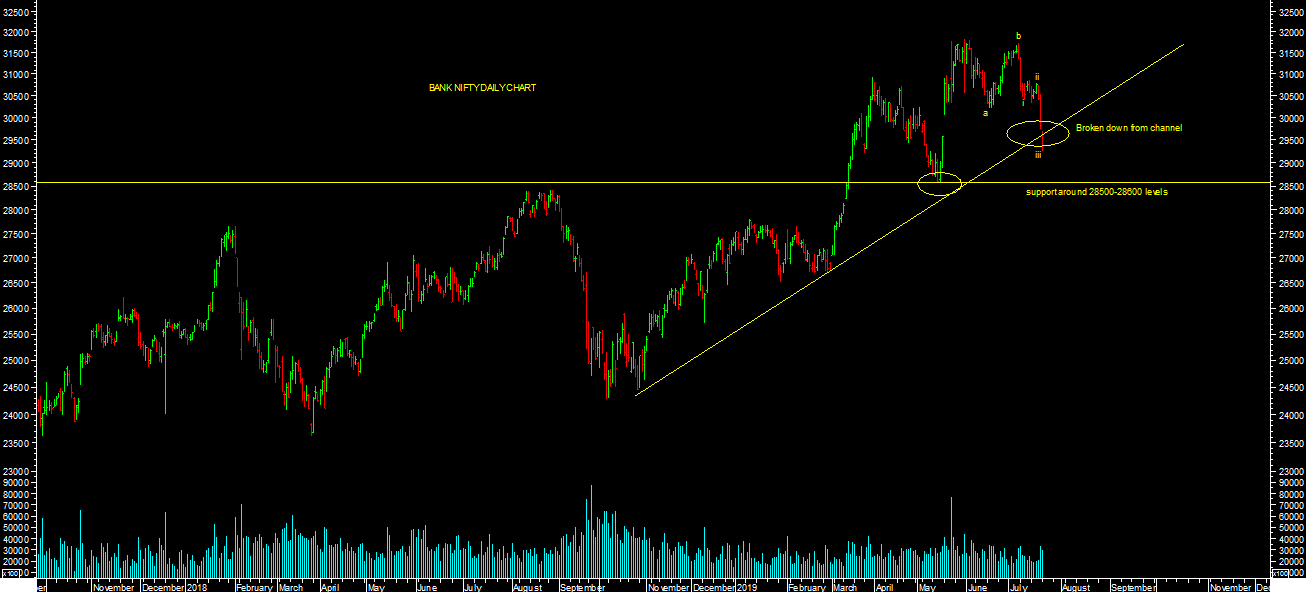
BANK NIFTY also broken down from channel as per chart attached. It has also achieved my short term targets levels as expected earlier. It made a low of 29265 levels so far in this correction. It looks like possibility of extension of correction further on down side towards 28500-28600 levels in short term. 30850 levels is strong resistance & reversal levels for short term. Any kind of pull back rally towards these higher levels is selling opportunity till it reverses. 23600 levels is strong support for medium term perspectives, till it holds, One can expect higher levels targets in the range of 34000 levels on medium term.
11300 & 11500/11600 levels is strong support & resistance levels respectively based on option open interest data for expiry perspectives for current month series. Any kind of such short term correction or consolidation is stock specific buying opportunity for medium to long term Investment perspectives till medium term reverses.
Momentum indicators Daily KST & DAILY MACD both are in SELL supporting short term trend of market . One should be stock specific & follow the trend with trail stop loss levels till it reverses. Close above short term reversal levels will finally confirm trend towards further higher levels targets in medium term.
Momentum Perspective:
Weekly KST & WEEKLY MACD both are in BUY & market is closed above 20WESM & 40 WEMA. ALL Medium term momentum indicators are in BUY supporting medium term trend. Investor should follow trend till medium term reverses.
Conclusion:
Short Term Trend is DOWN & Medium term Trend is UP.
Trend
Market Outlook (Closing) as on 22.07.2019
Market closed in negative territory at 38, 031.13 (- 305.88)SHORT TERM TARGETS ACHIEVED: TRAIL TILL IT REVERSES:
BROKEN ON DOWN SIDE FROM CHANNEL: LOOKS LIKE EXTENSION CASE FURTHER ON DOWN SIDE IN SHORT TERM:
ANY KIND OF SHORT TERM VOLATALITY/ CONSOLIDATION OR DECLINE IS STOCK SPECIFIC BUYING OPPORTUNITY FOR SHORT TO MEDIUM TERM INVESTMENT PERSPECTIVES:TRAIL TILL IT REVERSES:
As mentioned earlier, We have seen sharp correction after completion of wave-5 near recent high of 12103.05 levels on nifty & 40,312.07 levels on sensex. We are in corrective mode in short term, although overall wave count is still not conclusive at current levels of market but its divergence market is still not TOP OUT from medium to long term perspectives. Therefore, Any kind of such correction is stock specific buying opportunity from medium to long term persepctives.
Broader market such as midcap & small cap indices is almost near october 2018 lows & Strongly underperforming in last 18 months inspite of being main indices such as nifty/sensex & Bank nifty is hitting all time high levels. we are seeing these divergence between main indices & broader market. I am anitcipating these divergence to end soon but its still not happening, its warning sign at current levels of market. It has to catch up & participate now for my over all medium to long term bullish trend of market. One should closely watchout broader market behavior at current levels of market.
BANK NIFTY also broken down from channel as per chart attached. It has also achieved my short term targets levels as expected earlier. It made a low of 29265 levels so far in this correction. It looks like possibility of extension of correction further on down side towards 28500-28600 levels in short term. 30850 levels is strong resistance & reversal levels for short term. Any kind of pull back rally towards these higher levels is selling opportunity till it reverses. 23600 levels is strong support for medium term perspectives, till it holds, One can expect higher levels targets in the range of 34000 levels on medium term.
11300 & 11500/11600 levels is strong support & resistance levels respectively based on option open interest data for expiry perspectives for current month series. Any kind of such short term correction or consolidation is stock specific buying opportunity for medium to long term Investment perspectives till medium term reverses.
Momentum indicators Daily KST & DAILY MACD both are in SELL supporting short term trend of market . One should be stock specific & follow the trend with trail stop loss levels till it reverses. Close above short term reversal levels will finally confirm trend towards further higher levels targets in medium term.
Momentum Perspective:
Weekly KST & WEEKLY MACD both are in BUY & market is closed above 20WESM & 40 WEMA. ALL Medium term momentum indicators are in BUY supporting medium term trend. Investor should follow trend till medium term reverses.Conclusion:
Short Term Trend is DOWN & Medium term Trend is UP.
Trend
| Short Term : | Trend | Reversal |
| 36950 | 40032 | |
| Medium Term : | Trend | Reversal |
| 42500-43000 | 32483 |
| Short Term : | Trend | Reversal |
| 11100 | 11800 | |
| Medium Term : | Trend | Reversal |
| 12600-12900 | 9951 |