
Market Outlook
THURSAY, DECEMBER 24, 2020
Market Outlook (Closing) as on 24.12.2020
Market closed in Positive territory at 46,973.54 (+ 529.36)
SHAKEN OUT OF WEAK BULLS IN SHORT TERM:
EXTENDING FURTHER IN SHORT TERM IN WAVE-V OF 3: TRAIL TILL IT REVERSES:
CONSOLIDATION CONTINUE BETWEEN BROAD RANGE OF 13000-14000 LEVELS ON NIFTY FOR MEDIUM TERM PERSPECTIVES FOR SOME MORE TIME : TRAILTILL IT REVERES:
BANK NIFTY LOOKS TO OUTPERFORM IN SHORT TERM:
STILL LOOKS LIKE “W ” SHAPE RECOVERY OR PULL BACK RALLY LIKE 1998-2003 STRUCTURE OF MARKET:
MISSING WAVE- V OF BULL MARKET:
BE STOCK SPECIFIC IN THIS PHASE OF MARKET:
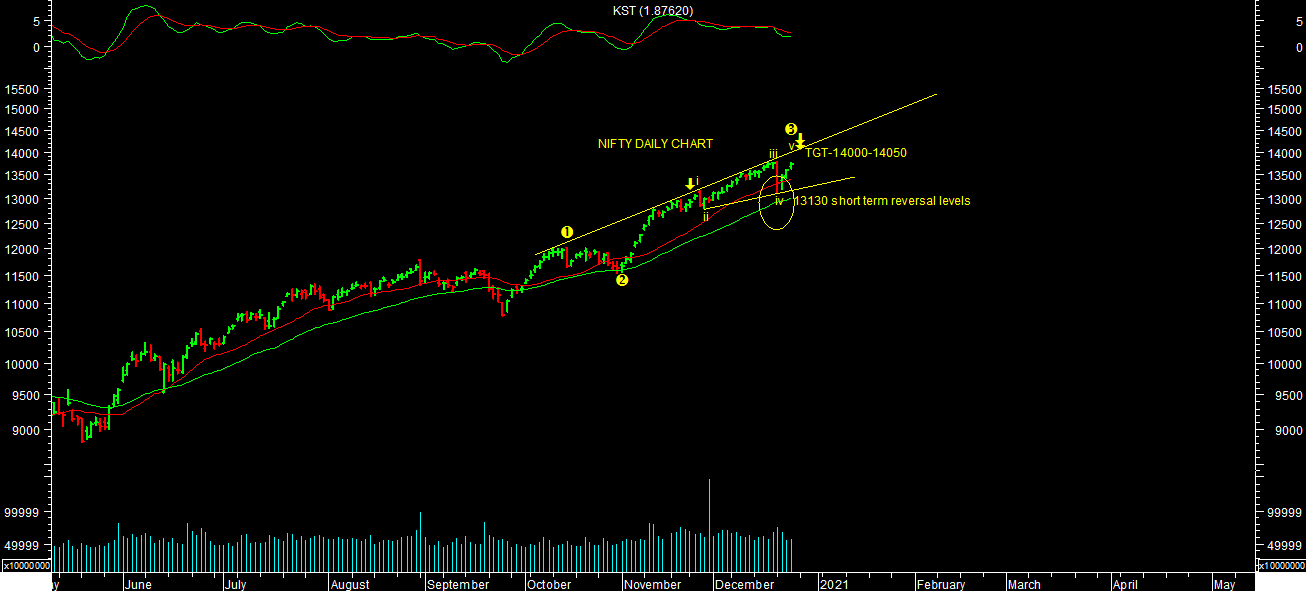
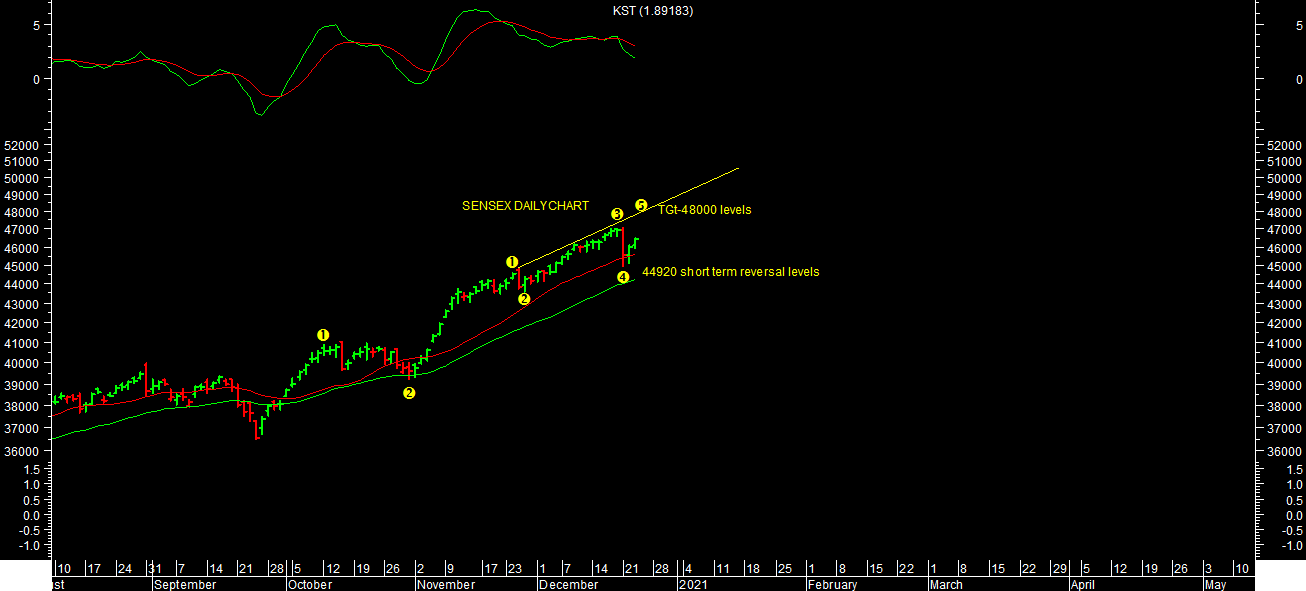
 Market sharply reverses from lower levels & once again extending towards life time high. It made a low of 13130 levels on nifty & 44923.08 levels in short term. It has shaken out weak BULLS for short term trading perspectives in this sharp one day fall with high volatility. Although momentum is losing but market will extend further towards life time high once again towards short term targets levels. Trader should be stock specific & keep periodic profit booking in this phase of market.
It looks like Wave-V of 3 is progressing from short term wave counts perspectives as per chart attached both on NIFTY/SENSEX & BANK NIFTY as well. One can expect market to trend towards higher levels targets till it reverses. It may broadly consolidate between 13000-14000 levels for some more time from medium term perspectives till it reverses. One should be stock specific & keep periodic profit booking in this phase of market.
It still looks like “W” shape recovery or rally like 1998-2003 structure. And it’s missing Wave-V of higher degree from wave count perspectives. So one can’t rule out sharp correction, once this rally completes, towards further lower levels targets towards 2019 lows or retracement of entire rally from March 2019 lows. So one should be very stock specific in this phase of market.
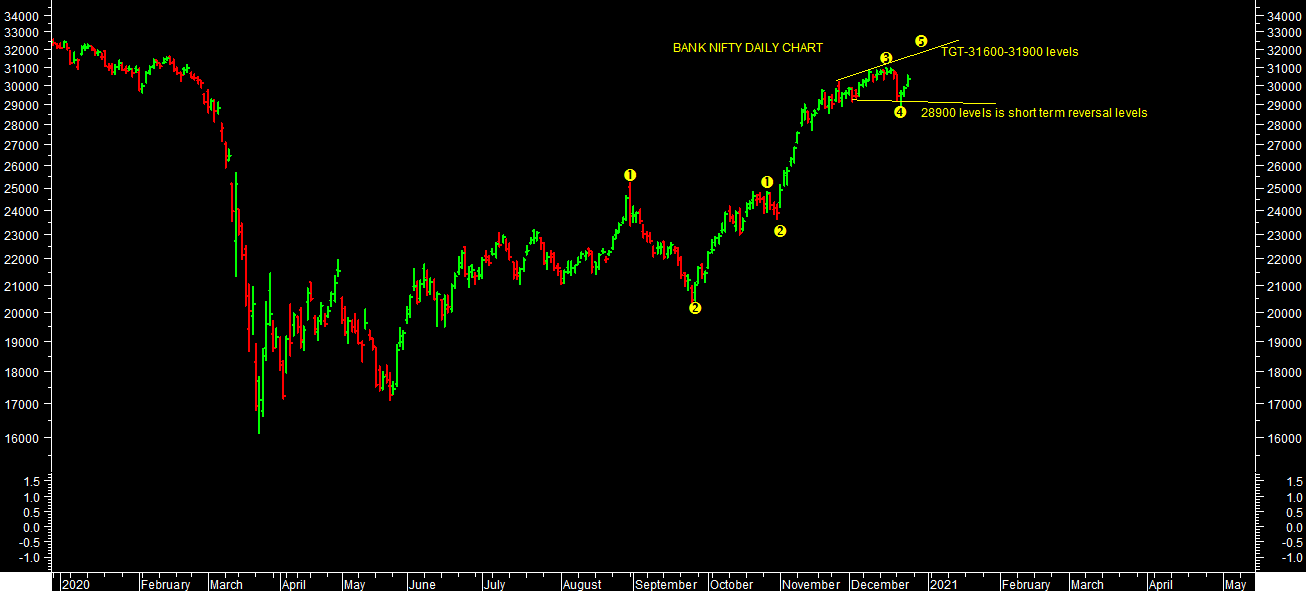
BANK NIFTY also witnessed sharp profit booking from higher levels. It made low of 29000 levels so far in this correction. It also looks like wave-V of 3 is progressing on bank nifty in short term from wave count perspectives in short term. One can expect BANK NIFTY to outperform in this phase of rally in short term. 28900 is strong support for short term, till it holds one can expect market to trend towards 31600-31900 levels in short term. 25200 levels is strong support for overall bullish view on bank nifty, till it holds once can expect higher levels targets till 32600-34000 levels in medium term.
13500/14000 is strong support & Resistance levels respectively based on option open interest data for current month series so far. Market may continue to consolidate between 13000-14000 levels from medium term perspectives.
Momentum indicators Daily KST & Daily MACD both are in SELL indicating volatile trend in short term. Close below short term reversal levels will lead to sharp sell off towards 12800 levels on nifty & 43580 levels on sensex in short term. One should be stock specific & follow trend with trail stop loss levels till it reverses in short term
Momentum Perspective:
Weekly KST & WEEKLY MACD both are in BUY. Market is still closed above 20WESM & 40 WEMA. One should wait for price reversal to finally conclude medium term reversal.
Conclusion:
Short Term Trend is UP & Medium term Trend is UP
Trend
Market Outlook (Closing) as on 24.12.2020
Market closed in Positive territory at 46,973.54 (+ 529.36)SHAKEN OUT OF WEAK BULLS IN SHORT TERM:
EXTENDING FURTHER IN SHORT TERM IN WAVE-V OF 3: TRAIL TILL IT REVERSES:
CONSOLIDATION CONTINUE BETWEEN BROAD RANGE OF 13000-14000 LEVELS ON NIFTY FOR MEDIUM TERM PERSPECTIVES FOR SOME MORE TIME : TRAILTILL IT REVERES:
BANK NIFTY LOOKS TO OUTPERFORM IN SHORT TERM:
STILL LOOKS LIKE “W ” SHAPE RECOVERY OR PULL BACK RALLY LIKE 1998-2003 STRUCTURE OF MARKET:
MISSING WAVE- V OF BULL MARKET:
BE STOCK SPECIFIC IN THIS PHASE OF MARKET:
It looks like Wave-V of 3 is progressing from short term wave counts perspectives as per chart attached both on NIFTY/SENSEX & BANK NIFTY as well. One can expect market to trend towards higher levels targets till it reverses. It may broadly consolidate between 13000-14000 levels for some more time from medium term perspectives till it reverses. One should be stock specific & keep periodic profit booking in this phase of market.
It still looks like “W” shape recovery or rally like 1998-2003 structure. And it’s missing Wave-V of higher degree from wave count perspectives. So one can’t rule out sharp correction, once this rally completes, towards further lower levels targets towards 2019 lows or retracement of entire rally from March 2019 lows. So one should be very stock specific in this phase of market.
BANK NIFTY also witnessed sharp profit booking from higher levels. It made low of 29000 levels so far in this correction. It also looks like wave-V of 3 is progressing on bank nifty in short term from wave count perspectives in short term. One can expect BANK NIFTY to outperform in this phase of rally in short term. 28900 is strong support for short term, till it holds one can expect market to trend towards 31600-31900 levels in short term. 25200 levels is strong support for overall bullish view on bank nifty, till it holds once can expect higher levels targets till 32600-34000 levels in medium term.
13500/14000 is strong support & Resistance levels respectively based on option open interest data for current month series so far. Market may continue to consolidate between 13000-14000 levels from medium term perspectives.
Momentum indicators Daily KST & Daily MACD both are in SELL indicating volatile trend in short term. Close below short term reversal levels will lead to sharp sell off towards 12800 levels on nifty & 43580 levels on sensex in short term. One should be stock specific & follow trend with trail stop loss levels till it reverses in short term
Momentum Perspective:
Weekly KST & WEEKLY MACD both are in BUY. Market is still closed above 20WESM & 40 WEMA. One should wait for price reversal to finally conclude medium term reversal.Conclusion:
Short Term Trend is UP & Medium term Trend is UP
Trend
| Short Term : | Trend | Reversal |
| 47500-48300 | 44923 | |
| Medium Term : | Trend | Reversal |
| 49000 | 41048 |
| Short Term : | Trend | Reversal |
| 14000-14200 | 13130 | |
| Medium Term : | Trend | Reversal |
| 14800 | 12020 |