
Market Outlook
WEDNESDAY, March 03, 2021
Market Outlook (Closing) as on 03.03.2021
Market closed in positive territory at 51444.65 (+1147.76)
EXTENDING FURTHER IN SHORT TERM: TRAIL TILL IT REVERSES:
MAY REMAIN IN RANGE BOUND IN SHORT TERM: KEEPS PROFIT BOOKING AT REGULAR INTERVELS:
STILL LOOKS LIKE “W ” SHAPE RECOVERY OR PULL BACK RALLY LIKE 1998-2003 STRUCTURE OF MARKET:
MISSING WAVE- V OF BULL MARKET:
BE STOCK SPECIFIC AND NOT TO BE CARRIED AWAY WITH TOO MUCH LEVERAGE IN THIS EUPH ORIC PHASE OF MARKET:
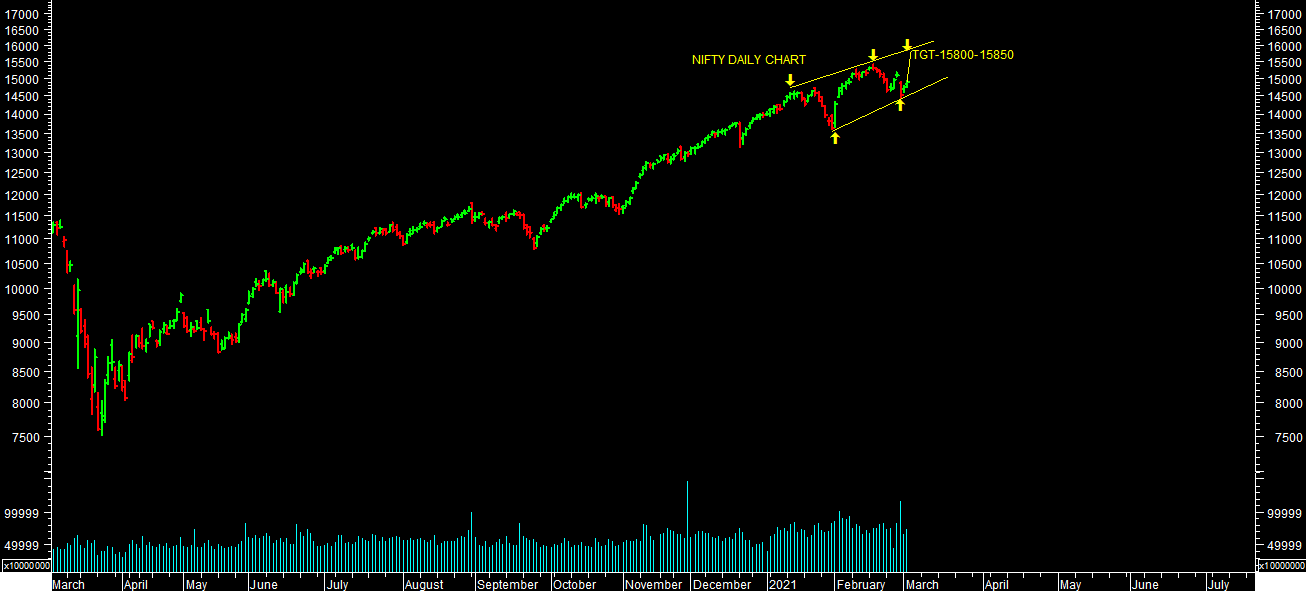
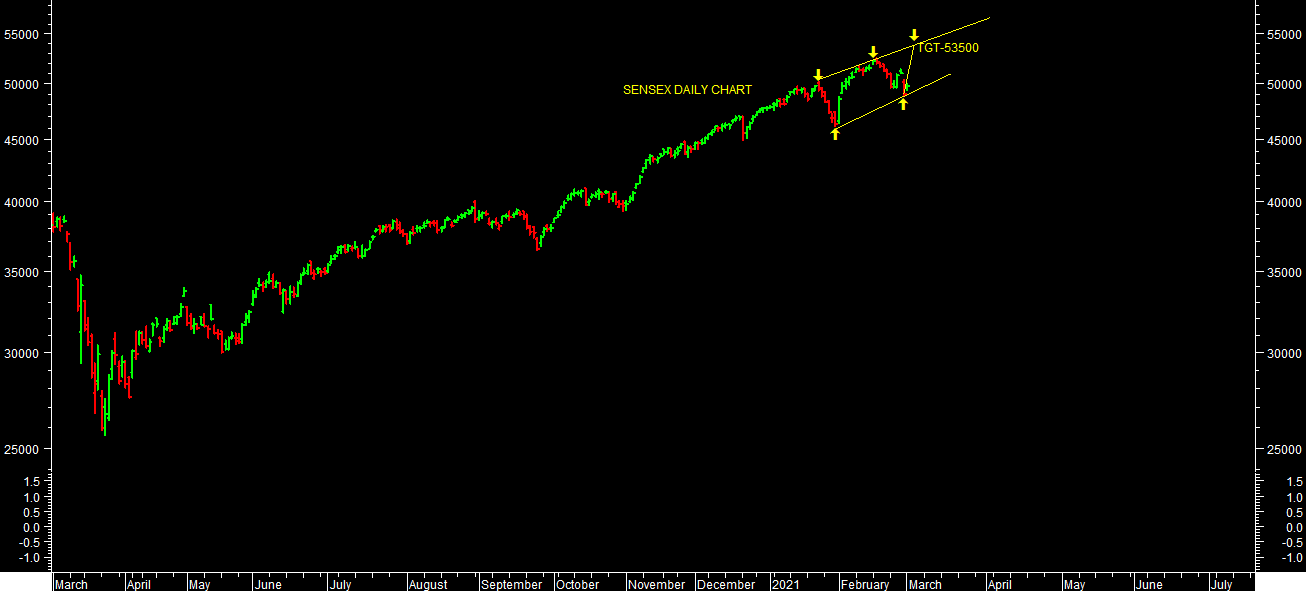
 Market showing sign of extension further & confirmed short term reversal. It can extend further towards higher levels targets in short term. It may remain range bound in broad range of 15500-14500 levels as other possibility. Stock specific movement will continue, therefore, one should keep stock specific approach & keep profit booking at regular intervals & follow trend till it reverses.
Although I have concluded end of 5 wave advance rally from bottom of March 2020 in my earlier outlook & raised warning sign as upper end of channel. But now wave counts is showing bit confusion in this extending distribution phase of market. Therefore, One should be stock specific & not to be carried away & too much leverage at this levels of market.
On the other hand, Global market (Particularly USA Market) also looks for short term poised or profit booking. It also looks like possibility of end of 5 wave advance rally from bottom of March 2020. Currency (USD/INR) also witnessed sharp reversal from crucial support near $72.25 levels. Gold is also trading near crucial support levels. This also evidences indicating for some kind of caution or advance warning in short term.
It still looks like “W” shape recovery or rally like 1998-2003 structure. And it’s missing Wave-V of higher degree from wave count perspectives. So one can’t rule out sharp correction, once this rally completes, towards further lower levels targets towards 2019 lows or retracement of entire rally from March 2019 lows. So one should be very stock specific in this phase of market.
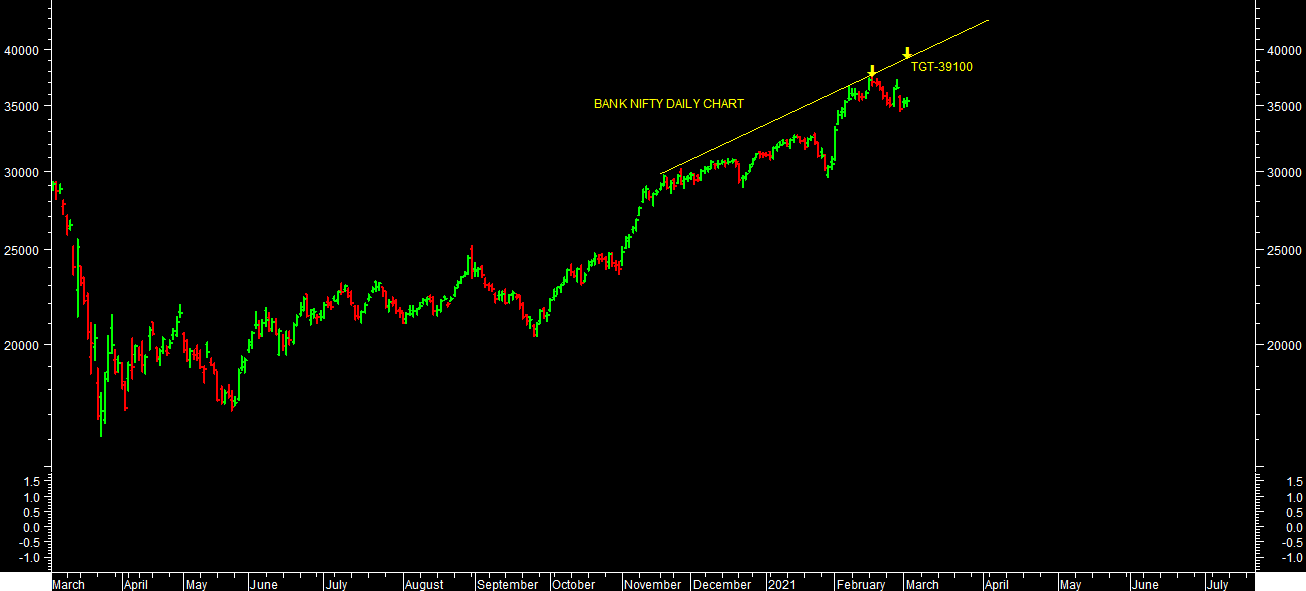
BANK NIFTY also looks like end of 5 wave advance rally from bottom of March 2020 as per earlier outlook. It may remain in range of 34650-37700 levels for some more time or it can stretch till 39000 levels in case of extension further in this distribution phase, if sustain above 37700 levels. View remains positive on bank nifty till holds support of 34650 levels. 29680 levels is strong support on bank nifty for medium term perspectives on bank nifty.
14500-15500 is strong support zone & Resistance zone levels respectively based on option open interest data for expiry perspectives for current month so far based on option open interest data.
Momentum indicators Daily KST & Daily MACD are in SELL indicating volatile trend for short term. Close & sustain below short term reversal levels will lead to sharp fall towards 46000 levels on sensex & 13600 levels on nifty in short term. One should be stock specific & not to be carried away with too much leverage in this euphoric phase of market & follow trend with trail stop loss levels till it reverses.
Momentum Perspective:
Weekly KST & WEEKLY MACD both went in to SELL. Market is still closed above 20WESM & 40 WEMA. One should wait for price reversal to finally conclude medium term reversal.
Conclusion:
Short Term Trend is UP & Medium term Trend is UP
Trend
Market Outlook (Closing) as on 03.03.2021
Market closed in positive territory at 51444.65 (+1147.76)EXTENDING FURTHER IN SHORT TERM: TRAIL TILL IT REVERSES:
MAY REMAIN IN RANGE BOUND IN SHORT TERM: KEEPS PROFIT BOOKING AT REGULAR INTERVELS:
STILL LOOKS LIKE “W ” SHAPE RECOVERY OR PULL BACK RALLY LIKE 1998-2003 STRUCTURE OF MARKET:
MISSING WAVE- V OF BULL MARKET:
BE STOCK SPECIFIC AND NOT TO BE CARRIED AWAY WITH TOO MUCH LEVERAGE IN THIS EUPH ORIC PHASE OF MARKET:
Although I have concluded end of 5 wave advance rally from bottom of March 2020 in my earlier outlook & raised warning sign as upper end of channel. But now wave counts is showing bit confusion in this extending distribution phase of market. Therefore, One should be stock specific & not to be carried away & too much leverage at this levels of market.
On the other hand, Global market (Particularly USA Market) also looks for short term poised or profit booking. It also looks like possibility of end of 5 wave advance rally from bottom of March 2020. Currency (USD/INR) also witnessed sharp reversal from crucial support near $72.25 levels. Gold is also trading near crucial support levels. This also evidences indicating for some kind of caution or advance warning in short term.
It still looks like “W” shape recovery or rally like 1998-2003 structure. And it’s missing Wave-V of higher degree from wave count perspectives. So one can’t rule out sharp correction, once this rally completes, towards further lower levels targets towards 2019 lows or retracement of entire rally from March 2019 lows. So one should be very stock specific in this phase of market.
BANK NIFTY also looks like end of 5 wave advance rally from bottom of March 2020 as per earlier outlook. It may remain in range of 34650-37700 levels for some more time or it can stretch till 39000 levels in case of extension further in this distribution phase, if sustain above 37700 levels. View remains positive on bank nifty till holds support of 34650 levels. 29680 levels is strong support on bank nifty for medium term perspectives on bank nifty.
14500-15500 is strong support zone & Resistance zone levels respectively based on option open interest data for expiry perspectives for current month so far based on option open interest data.
Momentum indicators Daily KST & Daily MACD are in SELL indicating volatile trend for short term. Close & sustain below short term reversal levels will lead to sharp fall towards 46000 levels on sensex & 13600 levels on nifty in short term. One should be stock specific & not to be carried away with too much leverage in this euphoric phase of market & follow trend with trail stop loss levels till it reverses.
Momentum Perspective:
Weekly KST & WEEKLY MACD both went in to SELL. Market is still closed above 20WESM & 40 WEMA. One should wait for price reversal to finally conclude medium term reversal.Conclusion:
Short Term Trend is UP & Medium term Trend is UP
Trend
| Short Term : | Trend | Reversal |
| 52600-53500 | 48890 | |
| Medium Term : | Trend | Reversal |
| 54500 | 46160 |
| Short Term : | Trend | Reversal |
| 15500-15850 | 14467 | |
| Medium Term : | Trend | Reversal |
| 16100 | 13596 |