
Market Outlook
FRIDAY, March 19, 2021
Market Outlook (Closing) as on 19.03.2021
Market closed in positive territory at 49858.24 (+641.72)
LOWER END OF CHANNEL SUPPORT HOLDS:
FINAL PUSH TOWARDS HIGHER LEVELS TARGETS IN SHORT TO MEDIUM TERM: TRAIL TILL IT REVERSES
EXPECT SHARP MOVE MENT ON UPSIDE HIGER LEVELS TARGETS IN SHORT TERM TILL IT REVERSES:
STILL LOOKS LIKE “W ” SHAPE RECOVERY OR PULL BACK RALLY LIKE 1998-2003 STRUCTURE OF MARKET:
MISSING WAVE- V OF BULL MARKET:
BE STOCK SPECIFIC AND NOT TO BE CARRIED AWAY WITH TOO MUCH LEVERAGE IN THIS EUPH ORIC PHASE OF MARKET:
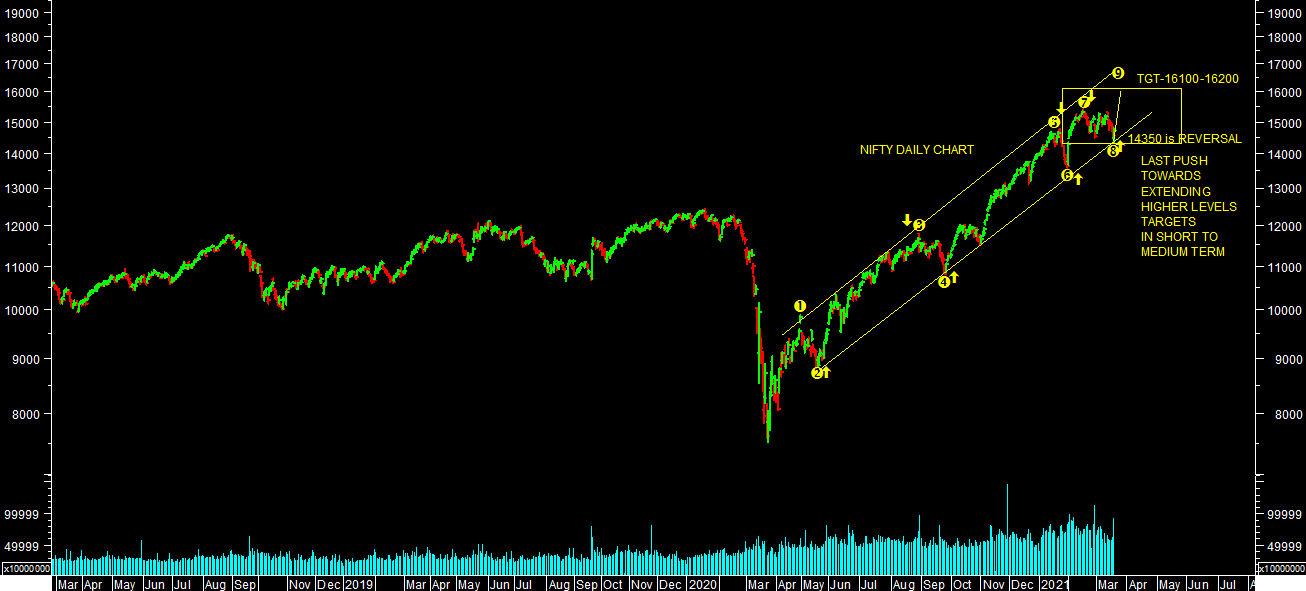
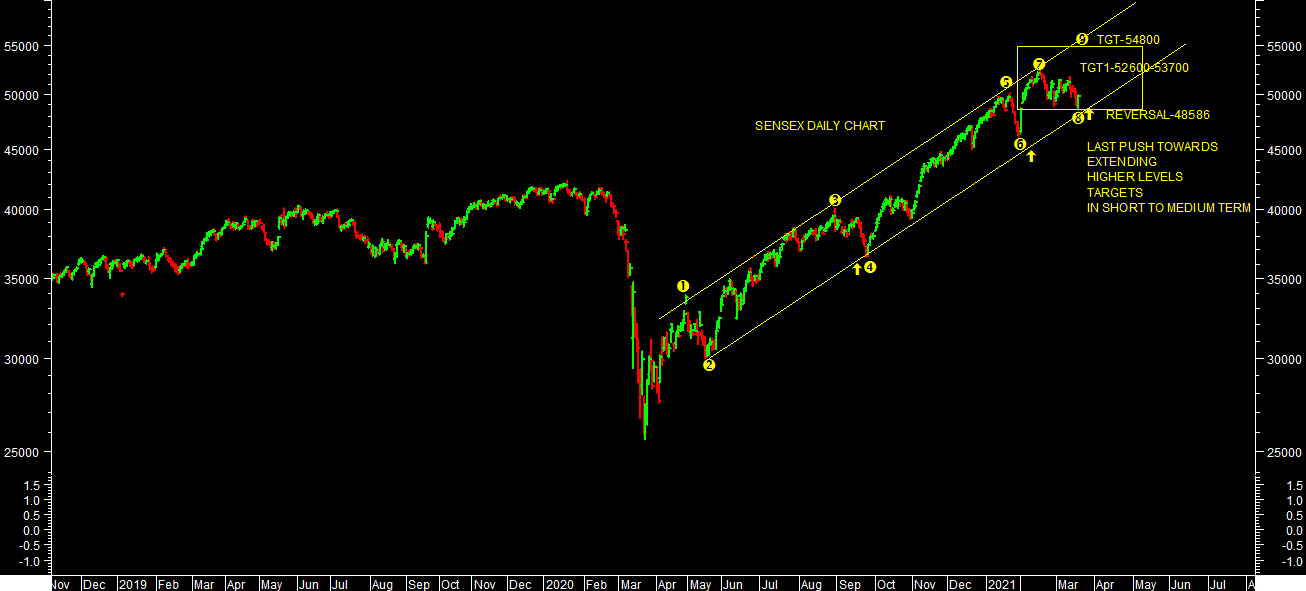
 Market trading in range from last 4-5 weeks in the range of 14500-15200 levels as expected. It once again managed to hold lower end of support zone & sharply reverses from these levels. It made a low of 14350 levels on nifty & 48586 levels on sensex. Now it’s looks like, time for trending move for higher levels targets in short to medium term till short term reverses. One should keep stock specific approach & keep profit booking at regular intervals & follow trend till it reverses.
It looks like last push of extended rally started from March 2020 for higher levels targets from overall wave counts perspectives as per chart attached. One can expect market to trend towards higher levels targets in short to medium term till it reverses.
Market showing sign of extension further & confirmed short term reversal. It can extend further towards higher levels targets in short term. It may remain range bound in broad range of 15500-14500 levels as other possibility. Stock specific movement will continue, therefore, one should keep stock specific approach & keep profit booking at regular intervals & follow trend till it reverses.
It still looks like “W” shape recovery or rally like 1998-2003 structure. And it’s missing Wave-V of higher degree from wave count perspectives. So one can’t rule out sharp correction, once this rally completes, towards further lower levels targets towards 2019 lows or retracement of entire rally from March 2019 lows. So one should be very stock specific in this phase of market.
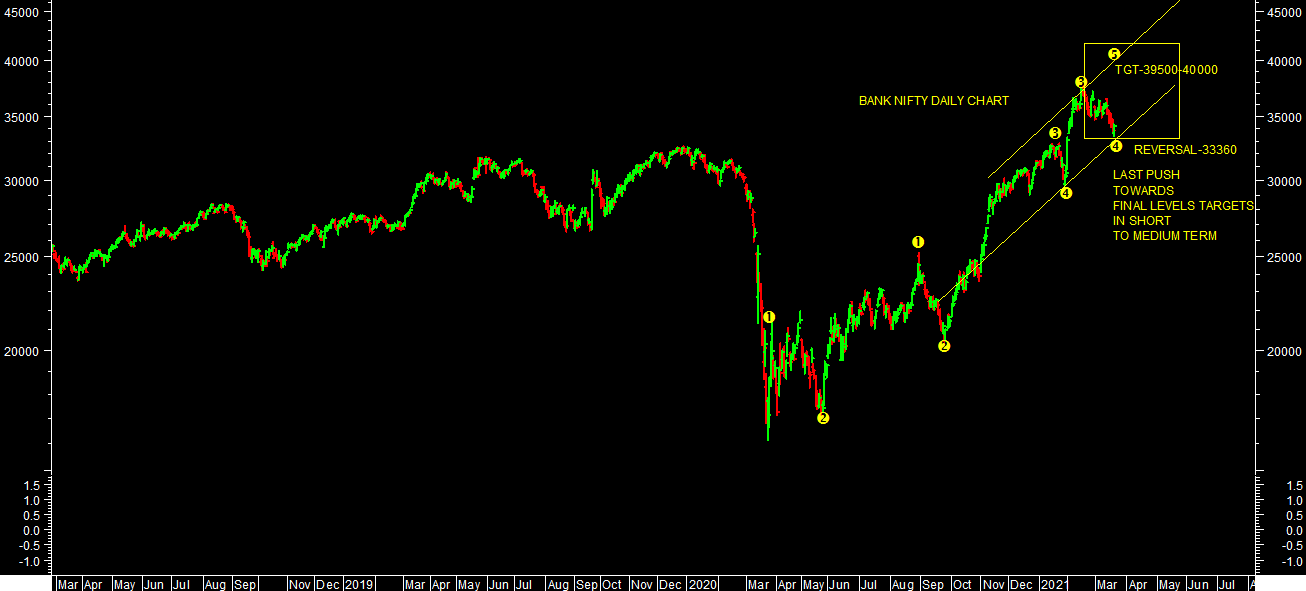
BANK NIFTY also looks like completed short term correction cum consolidation. It made a low of 33360 levels so far in this correction. It also managed to hold lower end of support zone as per chart attached. One can bank nifty to move towards higher levels target1-39500 & target2-40500 levels in short to medium term till this support holds. 33360 in short term reversal or the same. It looks like final last leg up for bank nifty of rally started from March 2020 from overall wave counts perspectives as per chart attached. 29680 levels is strong support on bank nifty for medium term perspectives on bank nifty.
14000/14500-15000/15500 is strong support zone & Resistance zone levels respectively based on option open interest data for expiry perspectives for current month so far based on option open interest data.
Momentum indicators Daily KST & Daily MACD are in SELL indicating volatile trend for short term. Close & sustain below short term reversal levels will lead to sharp fall towards 46000 levels on sensex & 13600 levels on nifty in short term. One should be stock specific & not to be carried away with too much leverage in this euphoric phase of market & follow trend with trail stop loss levels till it reverses.
Momentum Perspective:
Weekly KST & WEEKLY MACD both went in to SELL. Market is still closed above 20WESM & 40 WEMA. One should wait for price reversal to finally conclude medium term reversal.
Conclusion:
Short Term Trend is UP & Medium term Trend is UP
Trend
Market Outlook (Closing) as on 19.03.2021
Market closed in positive territory at 49858.24 (+641.72)LOWER END OF CHANNEL SUPPORT HOLDS:
FINAL PUSH TOWARDS HIGHER LEVELS TARGETS IN SHORT TO MEDIUM TERM: TRAIL TILL IT REVERSES
EXPECT SHARP MOVE MENT ON UPSIDE HIGER LEVELS TARGETS IN SHORT TERM TILL IT REVERSES:
STILL LOOKS LIKE “W ” SHAPE RECOVERY OR PULL BACK RALLY LIKE 1998-2003 STRUCTURE OF MARKET:
MISSING WAVE- V OF BULL MARKET:
BE STOCK SPECIFIC AND NOT TO BE CARRIED AWAY WITH TOO MUCH LEVERAGE IN THIS EUPH ORIC PHASE OF MARKET:
It looks like last push of extended rally started from March 2020 for higher levels targets from overall wave counts perspectives as per chart attached. One can expect market to trend towards higher levels targets in short to medium term till it reverses.
Market showing sign of extension further & confirmed short term reversal. It can extend further towards higher levels targets in short term. It may remain range bound in broad range of 15500-14500 levels as other possibility. Stock specific movement will continue, therefore, one should keep stock specific approach & keep profit booking at regular intervals & follow trend till it reverses.
It still looks like “W” shape recovery or rally like 1998-2003 structure. And it’s missing Wave-V of higher degree from wave count perspectives. So one can’t rule out sharp correction, once this rally completes, towards further lower levels targets towards 2019 lows or retracement of entire rally from March 2019 lows. So one should be very stock specific in this phase of market.
BANK NIFTY also looks like completed short term correction cum consolidation. It made a low of 33360 levels so far in this correction. It also managed to hold lower end of support zone as per chart attached. One can bank nifty to move towards higher levels target1-39500 & target2-40500 levels in short to medium term till this support holds. 33360 in short term reversal or the same. It looks like final last leg up for bank nifty of rally started from March 2020 from overall wave counts perspectives as per chart attached. 29680 levels is strong support on bank nifty for medium term perspectives on bank nifty.
14000/14500-15000/15500 is strong support zone & Resistance zone levels respectively based on option open interest data for expiry perspectives for current month so far based on option open interest data.
Momentum indicators Daily KST & Daily MACD are in SELL indicating volatile trend for short term. Close & sustain below short term reversal levels will lead to sharp fall towards 46000 levels on sensex & 13600 levels on nifty in short term. One should be stock specific & not to be carried away with too much leverage in this euphoric phase of market & follow trend with trail stop loss levels till it reverses.
Momentum Perspective:
Weekly KST & WEEKLY MACD both went in to SELL. Market is still closed above 20WESM & 40 WEMA. One should wait for price reversal to finally conclude medium term reversal.Conclusion:
Short Term Trend is UP & Medium term Trend is UP
Trend
| Short Term : | Trend | Reversal |
| 52600-53500 | 48586 | |
| Medium Term : | Trend | Reversal |
| 54500-55200 | 46160 |
| Short Term : | Trend | Reversal |
| 15500-15850 | 14350 | |
| Medium Term : | Trend | Reversal |
| 16100-16200 | 13596 |