
Market Outlook
MONDAY, April 18, 2022
Market Outlook (Closing) as on 18.04.2022
Market closed in negative territory at 57,166.74 (-1172.19)
CONCLUDING SHORT TERM REVERSAL: TRAIL TILL IT REVERSES
SHORT TO MEDIUM TERM WAVE-II CORRECTIVE VIEW IS STILL INTACT: SELL STOCK SPECIFIC IN ANY KIND OF PULL BACK RALLY ( SELL ON RISE APPORACH)
MARKET TO CORRECT TOWARDS LOWER LEVELS TARGETS IN SHORT TO MEDIUM TERM TILL IT REVERSES
SHARP RESISTANCE NEAR FROM MEDIUM TERM REVERSAL LEVELS:
TRIPLE TOP RESISTANCE AT HIGHER LEVELS:
GOOD OPPORTUNITY FOR LONG TERM INVESTOR TO BUY STOCK SPECIFIC IN TRANCHES IN THIS CORRECTIVE PHASE IN DISCIPLINED MANNER
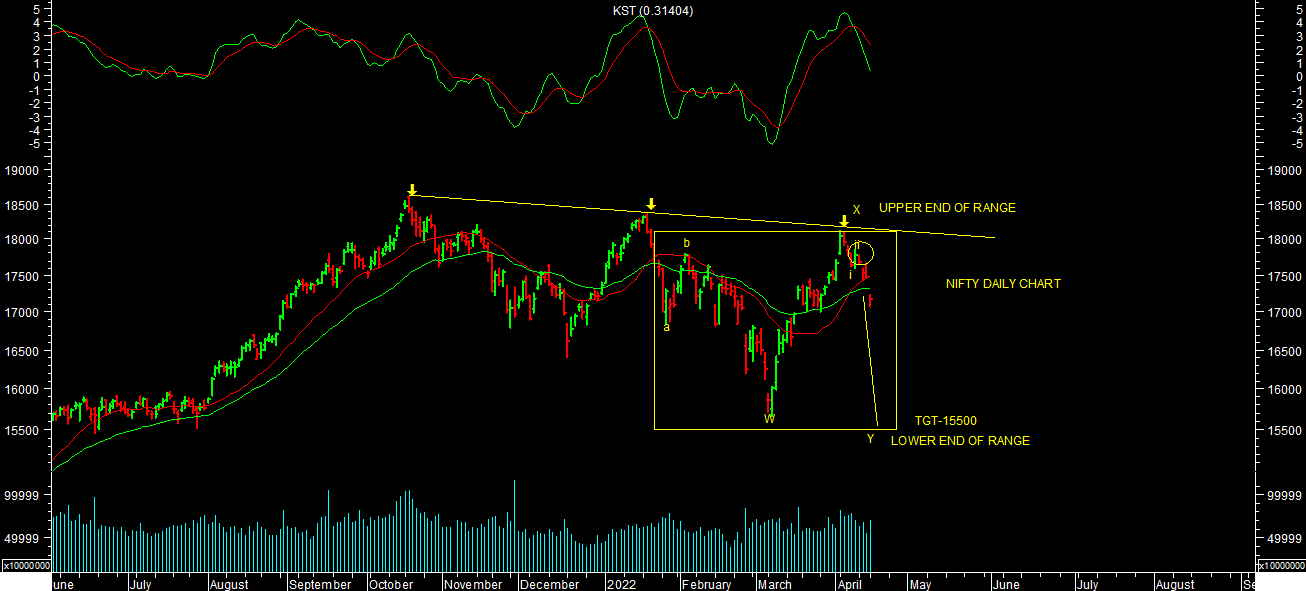
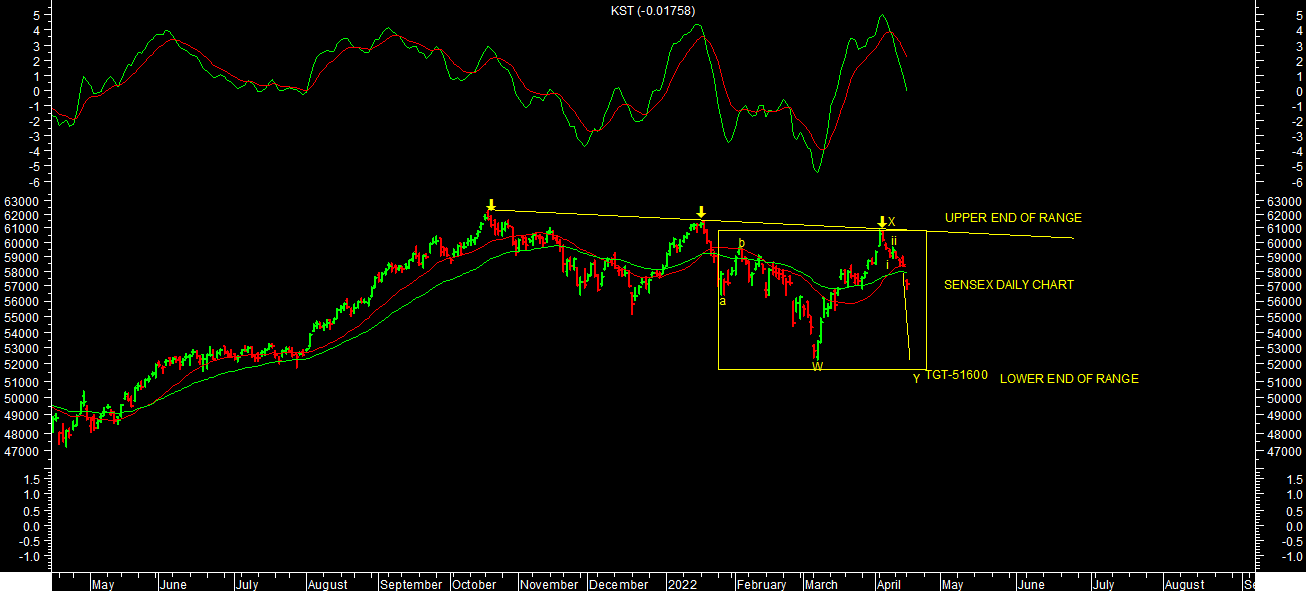
 Market failed to sustain at higher levels inspire of being surpassed all short term reversal levels & finally faced resistance near medium term reversal levels. It started to witness selling pressure from this level. It made a high of 18114.65 levels on nifty & 60,845.10 levels on sensex so far in this pull back rally. Market retraced almost 80-85% in this pull back rally from March 2022 lows beyond my expectation & almost triggered my all revised short term reversal levels except medium term reversal levels as mentioned earlier. It still looks like wave-II corrective phase only as mentioned earlier as far as views on indices are concerned. It has finally broken range on (17440-18350 levels) nifty on lower side & closed below it. One can now expect market to trend towards lower levels targets in short to medium term as mentioned below till it reverses. Trader should sell stock specific at current levels or any kind of pull back rally till trend reveres.
It looks like wave-X of wave-II corrective phase has completed in this pull back rally near recent high of 18114.65 levels on nifty & 60,845.10 levels on sensex. It looks like beginning of wave-Y complex correction. One can expect market to trend towards lower levels targets in short to medium term till it reverses as per chart attached.
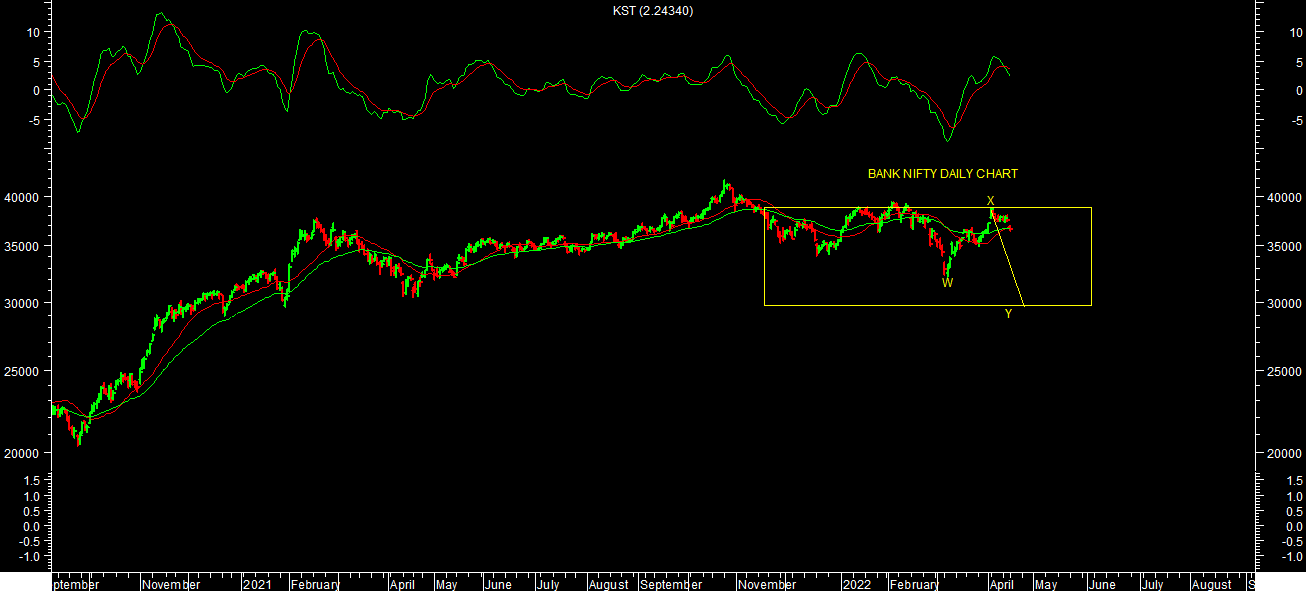
Bank nifty also completed wave-X pull back rally near recent high. It made a high of 38765.85 levels. It started to fall from these levels. It looks like beginning of wave-Y complex correction further towards lower levels targets in short to medium term till trend reverses. 38766 is short term reversl levels tillit holds one can expect lower levels targets 35000-34000 levels in short term. 39900 is medium term reversal levels for Bank nifty, till it holds one can expect lower levels targets of around 30000-29200 levels medium term. Trader should keep sell on rise approach on bank nifty at current levels or any kind of pull back rally from short to medium term perspectives till it reverses.
17000 & 17500 is strong support zone & Resistance zone levels respectively based on option open interest data for current month series so far from expiry perspectives. Derivative Open Interest data is also suggesting fresh built up of shorts position by FII & Long built up by clients at current levels supporting with short term view. It’s a sign of caution at current levels.
Momentum indicators Daily KST & Daily MACD both are in SELL supporting short term trend. Trader should have sell on rise approach in short term while Investor should use this corrective phase to buy stock specific in tranches in disciplined manner from long term persepctives.
Momentum Perspective:
Weekly KST & WEEKLY came in to BUY but Weekly MACD is still in SELL. Market closed above 20WESM & 40 WEMA. One should watch out for price Reversal to finally conclude Medium term Reversal
Conclusion:
Short Term Trend is UP & Medium term Trend is Down
Trend
Market Outlook (Closing) as on 18.04.2022
Market closed in negative territory at 57,166.74 (-1172.19)CONCLUDING SHORT TERM REVERSAL: TRAIL TILL IT REVERSES
SHORT TO MEDIUM TERM WAVE-II CORRECTIVE VIEW IS STILL INTACT: SELL STOCK SPECIFIC IN ANY KIND OF PULL BACK RALLY ( SELL ON RISE APPORACH)
MARKET TO CORRECT TOWARDS LOWER LEVELS TARGETS IN SHORT TO MEDIUM TERM TILL IT REVERSES
SHARP RESISTANCE NEAR FROM MEDIUM TERM REVERSAL LEVELS:
TRIPLE TOP RESISTANCE AT HIGHER LEVELS:
GOOD OPPORTUNITY FOR LONG TERM INVESTOR TO BUY STOCK SPECIFIC IN TRANCHES IN THIS CORRECTIVE PHASE IN DISCIPLINED MANNER
It looks like wave-X of wave-II corrective phase has completed in this pull back rally near recent high of 18114.65 levels on nifty & 60,845.10 levels on sensex. It looks like beginning of wave-Y complex correction. One can expect market to trend towards lower levels targets in short to medium term till it reverses as per chart attached.
Bank nifty also completed wave-X pull back rally near recent high. It made a high of 38765.85 levels. It started to fall from these levels. It looks like beginning of wave-Y complex correction further towards lower levels targets in short to medium term till trend reverses. 38766 is short term reversl levels tillit holds one can expect lower levels targets 35000-34000 levels in short term. 39900 is medium term reversal levels for Bank nifty, till it holds one can expect lower levels targets of around 30000-29200 levels medium term. Trader should keep sell on rise approach on bank nifty at current levels or any kind of pull back rally from short to medium term perspectives till it reverses.
17000 & 17500 is strong support zone & Resistance zone levels respectively based on option open interest data for current month series so far from expiry perspectives. Derivative Open Interest data is also suggesting fresh built up of shorts position by FII & Long built up by clients at current levels supporting with short term view. It’s a sign of caution at current levels.
Momentum indicators Daily KST & Daily MACD both are in SELL supporting short term trend. Trader should have sell on rise approach in short term while Investor should use this corrective phase to buy stock specific in tranches in disciplined manner from long term persepctives.
Momentum Perspective:
Weekly KST & WEEKLY came in to BUY but Weekly MACD is still in SELL. Market closed above 20WESM & 40 WEMA. One should watch out for price Reversal to finally conclude Medium term ReversalConclusion:
Short Term Trend is UP & Medium term Trend is Down
Trend
| Short Term : | Trend | Reversal |
| 55000-53300 | 59655 | |
| Medium Term : | Trend | Reversal |
| 52200-48500 | 61476 |
| Short Term : | Trend | Reversal |
| 16500-16000 | 17843 | |
| Medium Term : | Trend | Reversal |
| 15700-14300 | 18350 |