
Market Outlook
FRIAY, JULY 31, 2020
Market Outlook (Closing) as on 31.07.2020
Market closed in negative territory at 37,606.89 (- 129.18)
REVISING SHORT TERM REVERSAL LEVELSTO WATCHOUT FOR TO FINALLY CONCLUDE END OF PULL BACK RALLY:
PROFIT BOOKING FROM HIGHER LEVELS AFTER ACHIEVING SHORT TERM TARGETS LEVELS:
BE STOCK SPECIFIC IN THIS PHASE OF MARKET:
REVISING MEDIUM TERM REVERSAL LEVELS, AS LOOKS LIKE “ W ” SHAPE RECOVERY OR PULL BACK RALLY:
STILL LOOKS LIKE TYPICAL BEAR MARKET RALLY TILL MEDIUM TERM REVERSES:
 Market has achieved short term targets levels as mentioned & expected earlier near recent high in this pullback rally. It made high of 11341.40 levels on nifty &38,617.03 levels on sensex. It witnessed profit booking from these levels & closed weekly in negative territory at the end of trading session. Sustain above recent high will lead to possibility of further extension of rally towards revised short term targets levels as mentioned below. It’s trading in very thin range from last couple of trading session. Break of this range at either of side will lead to sharp trend in short term. One should closely watch out short term reversal levels as well in this indecisive zone & keep profit booking at regular intervals &trail till it reverses.
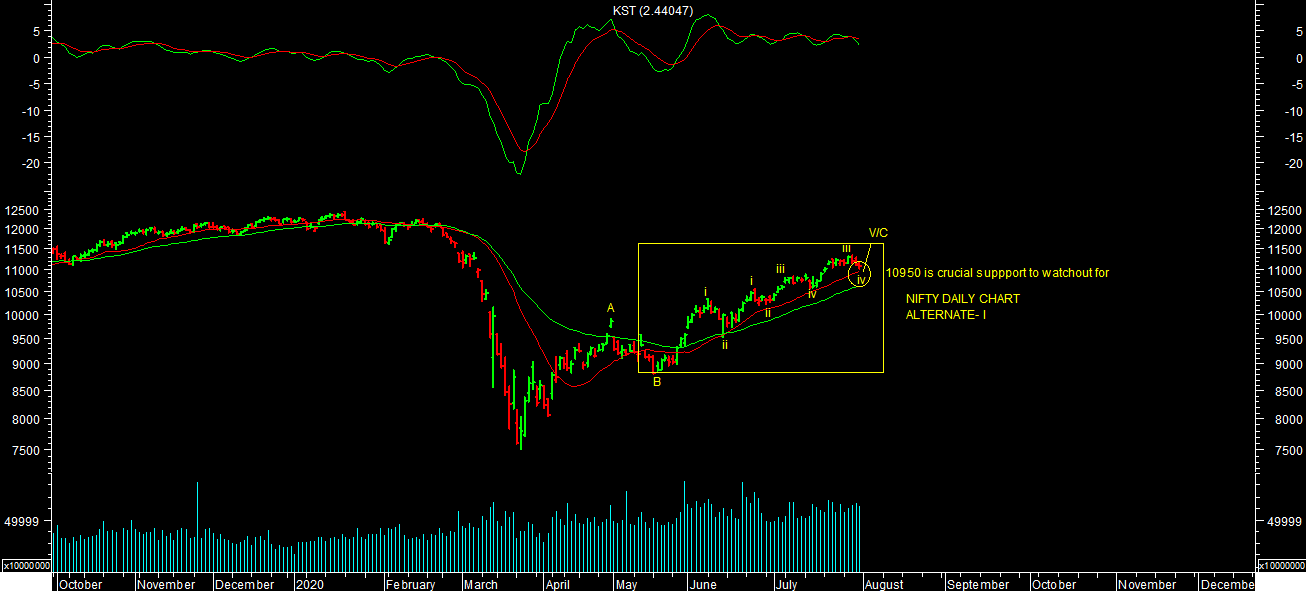
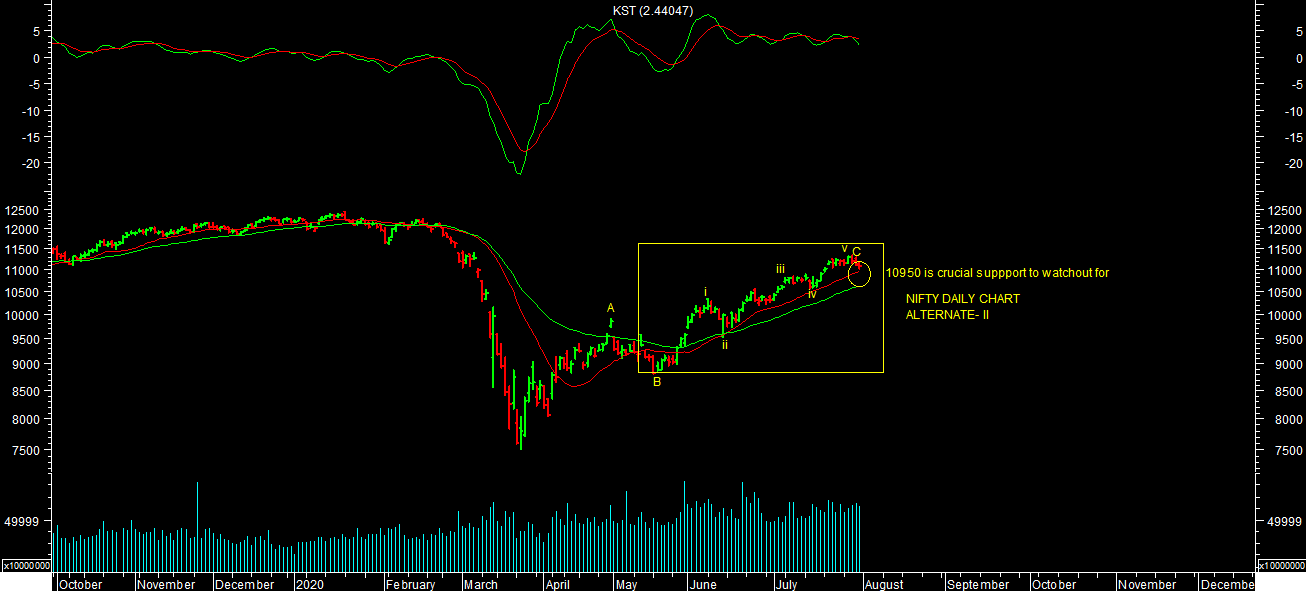
I have shared two alternate from short term wave count perspectives. In first case, ABC Pullback rally looks over with this weekly positive close & alternatively in second case, it has still possibility of wave-V of C pending on upside till short term reverses. My preferred one is second till short term reverses as per chart attached so far.
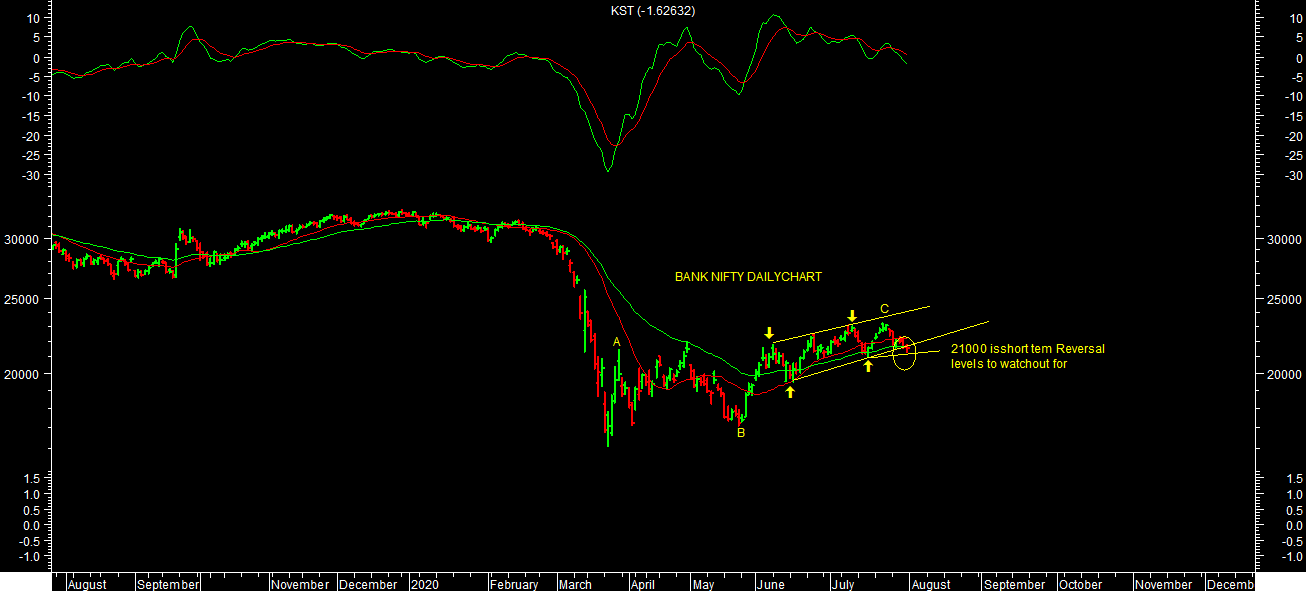
BANK NIFTY is underperforming at current levels of market. It has closed weekly in negative territory. It’s closed near crucial support/reversal levels as per chart attached. 21000 are strong support/Reversal levels for short term to finally conclude end of pull back rally on bank nifty. Till it holds one can expect it to once again retest it towards upper end of range towards 23500-24000 levels as per chart attached in short term. Close below 21000 levels will lead to sharp fall in bank nifty towards 19500 levels in short term. Although from medium term perspectives view remains down till it trades below 27000 levels , 27000 & expect lower levels targets till 17000/16000 levels in medium term.
10000 & 11000 levels is crucial support & Resistance levels range respectively based on option open interest data for expiry perspectives for current month series. I am also revising medium term reversal levels for overall trend of the market as below & it still looks like typical Bear Market rally till medium term reverses. And so far it’s turning out to be “W” shape recovery or pullback rally from medium term perspectives. It requires further more confirmation for finally conclude medium term reversal. I will periodically review for the same.
Momentum indicators Daily KST & Daily MACD both went in to SELL indicating volatile trend for short term. One should be stock specific & follow trend with trail stop loss levels till it reverses in short term. Close below short term reversal levels will lead to sharp fall towards 10600/10550 levels on nifty & 35870 levels on sensex is short term. One should periodically book profit & cautiously bullish at higher levels.
Momentum Perspective:
Weekly KST & WEEKLY MACD both are in BUY. Market is closed above 20WESM & 40 WEMA. Majority of medium term indicators are in BUY but One should wait for price reversal to finally conclude medium term reversal.
Conclusion:
Short Term Trend is UP & Medium term Trend is DOWN.
Trend
Market Outlook (Closing) as on 31.07.2020
Market closed in negative territory at 37,606.89 (- 129.18)REVISING SHORT TERM REVERSAL LEVELSTO WATCHOUT FOR TO FINALLY CONCLUDE END OF PULL BACK RALLY:
PROFIT BOOKING FROM HIGHER LEVELS AFTER ACHIEVING SHORT TERM TARGETS LEVELS:
BE STOCK SPECIFIC IN THIS PHASE OF MARKET:
REVISING MEDIUM TERM REVERSAL LEVELS, AS LOOKS LIKE “ W ” SHAPE RECOVERY OR PULL BACK RALLY:
STILL LOOKS LIKE TYPICAL BEAR MARKET RALLY TILL MEDIUM TERM REVERSES:
I have shared two alternate from short term wave count perspectives. In first case, ABC Pullback rally looks over with this weekly positive close & alternatively in second case, it has still possibility of wave-V of C pending on upside till short term reverses. My preferred one is second till short term reverses as per chart attached so far.
BANK NIFTY is underperforming at current levels of market. It has closed weekly in negative territory. It’s closed near crucial support/reversal levels as per chart attached. 21000 are strong support/Reversal levels for short term to finally conclude end of pull back rally on bank nifty. Till it holds one can expect it to once again retest it towards upper end of range towards 23500-24000 levels as per chart attached in short term. Close below 21000 levels will lead to sharp fall in bank nifty towards 19500 levels in short term. Although from medium term perspectives view remains down till it trades below 27000 levels , 27000 & expect lower levels targets till 17000/16000 levels in medium term.
10000 & 11000 levels is crucial support & Resistance levels range respectively based on option open interest data for expiry perspectives for current month series. I am also revising medium term reversal levels for overall trend of the market as below & it still looks like typical Bear Market rally till medium term reverses. And so far it’s turning out to be “W” shape recovery or pullback rally from medium term perspectives. It requires further more confirmation for finally conclude medium term reversal. I will periodically review for the same.
Momentum indicators Daily KST & Daily MACD both went in to SELL indicating volatile trend for short term. One should be stock specific & follow trend with trail stop loss levels till it reverses in short term. Close below short term reversal levels will lead to sharp fall towards 10600/10550 levels on nifty & 35870 levels on sensex is short term. One should periodically book profit & cautiously bullish at higher levels.
Momentum Perspective:
Weekly KST & WEEKLY MACD both are in BUY. Market is closed above 20WESM & 40 WEMA. Majority of medium term indicators are in BUY but One should wait for price reversal to finally conclude medium term reversal.Conclusion:
Short Term Trend is UP & Medium term Trend is DOWN.
Trend
| Short Term : | Trend | Reversal |
| 38300-39100/39700 | 36911 | |
| Medium Term : | Trend | Reversal |
| 32350-29968-27500 | 39500 |
| Short Term : | Trend | Reversal |
| 11380-11500 | 10882 | |
| Medium Term : | Trend | Reversal |
| 9500-8800-8000 | 11600 |